# aTCA System Manager

User's Manual

Manual Revision: 2.00

Revision Date: March 10, 2009

Part No: 50-1G008-1000

![Circular black-and-white recycling symbol with three white arrows forming a triangle (no text or symbols)](.atca-system-manager-50-1g008-1000-200/ec71e0ea9db9b15687659731ebc08102584186d3eaeaa7deb7b268c3e169b96d.jpg)

Recycled Paper

Revision History

<table><tr><td>Revision</td><td>Release Date</td><td>Description of Change(s)</td></tr><tr><td>2.00</td><td>2009/03/10</td><td>Initial Release</td></tr></table>

# Preface

# Copyright 2008 ADLINK Technology Inc.

This document contains proprietary information protected by copyright. All rights are reserved. No part of this manual may be reproduced by any mechanical, electronic, or other means in any form without prior written permission of the manufacturer.

# Disclaimer

The information in this document is subject to change without prior notice in order to improve reliability, design, and function and does not represent a commitment on the part of the manufacturer.

In no event will the manufacturer be liable for direct, indirect, special, incidental, or consequential damages arising out of the use or inability to use the product or documentation, even if advised of the possibility of such damages.

# Environmental Responsibility

ADLINK is committed to fulfill its social responsibility to global environmental preservation through compliance with the European Union's Restriction of Hazardous Substances (RoHS) directive and Waste Electrical and Electronic Equipment (WEEE) directive. Environmental protection is a top priority for ADLINK. We have enforced measures to ensure that our products, manufacturing processes, components, and raw materials have as little impact on the environment as possible. When products are at their end of life, our customers are encouraged to dispose of them in accordance with the product disposal and/or recovery programs prescribed by their nation or company.

# Trademarks

Product names mentioned herein are used for identification purposes only and may be trademarks and/or registered trademarks of their respective companies.

# Using this Manual

# Audience and Scope

The aTCA System Manager Installation and Interface User's Manual is intended for hardware and software technicians with knowledge of AdvancedTCA shelf manager systems and network computer systems.

# Manual Organization

This manual is organized as follows:

Preface: Presents important copyright notifications, disclaimers, trademarks, and associated information on the proper understanding and usage of this document and its associated product(s).

Chapter 1, Introduction: Introduces the aTCA System Manager, its technical specifications, operating requirements and equipment.

Chapter 2, Installation: Describes the hardware and software requirements of the aTCA System Manager and describes how to install the System Manager.

Chapter 3, Getting Started - aTCA-8505: Describes how to access the aTCA System Manager User Interface and its functions when used with an ADLINK aTCA-8505 chassis.

Chapter 4, Getting Started - aTCA-8214: Describes how to access the aTCA System Manager User Interface and its functions when used with an ADLINK aTCA-8214 chassis.

Chapter 5, Troubleshooting: Tips and solutions to possible system errors.

Getting Service: Contact information for ADLINK's worldwide offices.

# Conventions

Take note of the following conventions used throughout this manual to make sure that users perform certain tasks and instructions properly.

![An icon depicting a white document with a folded top-right corner and horizontal lines, featuring a large red checkmark superimposed over it.](.atca-system-manager-50-1g008-1000-200/19a6b9ba8f0cb16f7c95fb9c7c38d4a0828804b7829e4c3bc015de11e391e00f.jpg)
NOTE:

Additional information, aids, and tips that help users perform tasks.

![The image displays a yellow triangular warning sign with a black border. Centered inside the triangle is a large black exclamation point.](.atca-system-manager-50-1g008-1000-200/6e9d4730c554b56f1f3eeae4818be8128e1e199b8abe893b7216f148ce82096e.jpg)
CAUTION:

Information to prevent minor physical injury, component damage, data loss, and/or program corruption when trying to complete a task.

![The image features a maroon triangular warning sign containing a large white exclamation point in the center.](.atca-system-manager-50-1g008-1000-200/38e92a02b4531b07ad867a54499aafc82fb21224dab556430688e0e2278a9aef.jpg)
WARNING:

Information to prevent serious physical injury, component damage, data loss, and/or program corruption when trying to complete a specific task.

# Reference Documentation

The following list of documents may be used as reference materials to support installation, configuration and/or the operation of the ADLINK aTCA System Manager.

<table><tr><td>Vendor(s)</td><td>Title</td><td>Rev.</td></tr><tr><td>ADLINK Technology, Inc.</td><td>aCMM-2000aTCA Management Module</td><td>2.00</td></tr><tr><td>Intel®, Hewlett-Packard®, NEC, &amp; DellTM</td><td>Intelligent Platform ManagementInterface (IPMI) Specification v 1.5</td><td>1.1</td></tr><tr><td>PCI Industrial Computers Manufacturers Group (PICMG®)</td><td>AdvancedTCA® PICMG® 3.0Advanced TCA® Base Specification</td><td>2.0ECN-002</td></tr><tr><td>Red Hat®, Inc.</td><td>Red Hat® Linux® x86 Installation Guide</td><td>N/A</td></tr><tr><td>Red Hat®, Inc.</td><td>Fedora® Core 5 Installation Guide</td><td>N/A</td></tr><tr><td>Zend® Technologies Ltd.</td><td>User Guide: Zend OptimizerTM</td><td>3.0</td></tr></table>

# Table of Contents

# aTCA System Manager....i

# Preface...... iii

# Table of Contents...... vii

# List of Figures ...... xi

# 1 Introduction ...... 1

1.1 Overview.... 1
1.2 Functional Block Diagram.... 2
1.3 Specifications.... 3
1.4 Features.... 4

# 2 Installation 5

2.1 Hardware Requirements.... 5
2.2 Software Requirements 6
2.3 Installing Red Hat Linux 9....7
2.4 Installing Fedora Core 5 11
2.5 Installing aTCA System Manager Software 16

2.5.1 Installing to a New Copy of Linux 17
Install Tools 17
Install System Manager 25

2.5.2 Installing to an Existing Copy of Linux 26

2.6 Verifying MySQL and SNMP Packages.... 28

2.7 Network Security.... 29

2.7.1 Basic Firewall Security....30

2.7.2 Optimal Firewall Security 31

# 3 Getting Started - aTCA-8505 33

3.1 System Manager Startup 33
3.2 Login 34

3.2.1 Default Sensor Settings Screen....36
3.2.2 System Manager Main Screen 37

3.3 Navigating the User Interface 38

3.3.1 Quick Links 39

3.4 ATCA Boards 41

3.4.1 Getting ATCA Board Information 42
3.4.2 ATCA Board Settings....43
3.4.3 Configuring ATCA Board Sensors 45

3.5 Shelf Management Controller 46

3.5.1 Getting ShMC Module Information 47
3.5.2 ShMC Module Settings 48
3.5.3 Active CMM Sensor Data 49

3.6 Chassis Information 50

3.6.1 Chassis Sensor Data 50
3.6.2 Chassis Temperature Information & Settings 51
3.6.3 Fan Tray Information 53
3.6.4 Fan Tray Settings 54

3.7 Platform Event Filtering (PEF) 55

3.7.1 Setting PEF with System Manager 55
3.7.2 Setting PEF with Shelf Manager Command Line .....58
3.7.3 Monitoring SNMP Trap Alerts 58

# 4 Getting Started - aTCA-8214 61

4.1 System Manager Startup 61
4.2 Login 62

4.2.1 Default Sensor Settings Screen....64
4.2.2 System Manager Main Screen 66

4.3 Navigating the User Interface 67

4.3.1 Quick Links 69

# 4.4 ATCA Boards.... 71

4.4.1 Getting ATCA Board Information....72
4.4.2 ATCA Board Settings....73
4.4.3 Configuring ATCA Board Sensors....75

# 4.5 Shelf Management Controller 77

4.5.1 Getting ShMC Module Information 77
4.5.2 ShMC Module Settings....79

# 4.6 Chassis Information 80

4.6.1 Chassis Sensor Data 81
4.6.2 Fan Tray Information 82
4.6.3 Fan Tray Settings 82

# 4.7 Platform Event Filtering (PEF) 83

4.7.1 Setting PEF with System Manager 83
4.7.2 Setting PEF with Shelf Manager Command Line ..... 86
4.7.3 Monitoring SNMP Trap Alerts 86

# 5 Troubleshooting.... 89

# Getting Service.... 91

This page intentionally left blank.

# List of Figures

Figure 3-1: Login Screen 35

Figure 3-2: Default Sensor Settings Screen....36

Figure 3-3: System Manager Main Screen 37

Figure 3-4: Definitions & Color Codes Screen 40

Figure 3-5: ATCA Board Sensor Settings Screen....43

Figure 3-6: ATCA Board Sensor Configuration Screen 45

Figure 3-7: ShMC Module Sensor Settings Screen 48

Figure 3-8: Chassis Temp Critical Threshold Screen 52

Figure 3-9: Fan Tray Level Settings Screen 54

Figure 3-10: PEF Settings Screen 56

Figure 4-1: Login Screen 63

Figure 4-2: Default Sensor Settings Screen....65

Figure 4-3: System Manager Main Screen 66

Figure 4-4: Definitions & Color Codes Screen 70

Figure 4-5: ATCA Board Sensor Settings Screen....73

Figure 4-6: ATCA Board Sensor Configuration Screen 75

Figure 4-7: ShMC Module Sensor Settings Screen 79

Figure 4-8: Fan Tray Level Settings Screen 82

Figure 4-9: PEF Settings Screen 84

Figure 4-10: Example of aTCA-8214 with Slot 8 Alarm Alert......88

This page intentionally left blank.

# 1 Introduction

This chapter introduces the ADLINK aTCA System Manager, its technical specifications, features, operating requirements and associated equipment.

# 1.1 Overview

The ADLINK aTCA System Manager is an IP-based computer application which runs on a Linux web-server based on the TCP/IP protocol suite.

The System Manager is designed to monitor and manage all Chassis Management Modules (CMM) and Advanced Telecom Computing Architecture (AdvancedTCA or ATCA) board sensor data installed on an AdvancedTCA rackmount system.

The ADLINK aTCA System Manager is an IP-based system manager and is more powerful than standard shelf managers as it frees users from having to memorize cryptic commands. The ADLINK aTCA System Manager is also unique in that it offers users a simple and intuitive graphical user interface for monitoring and managing AdvancedTCA rackmount systems.

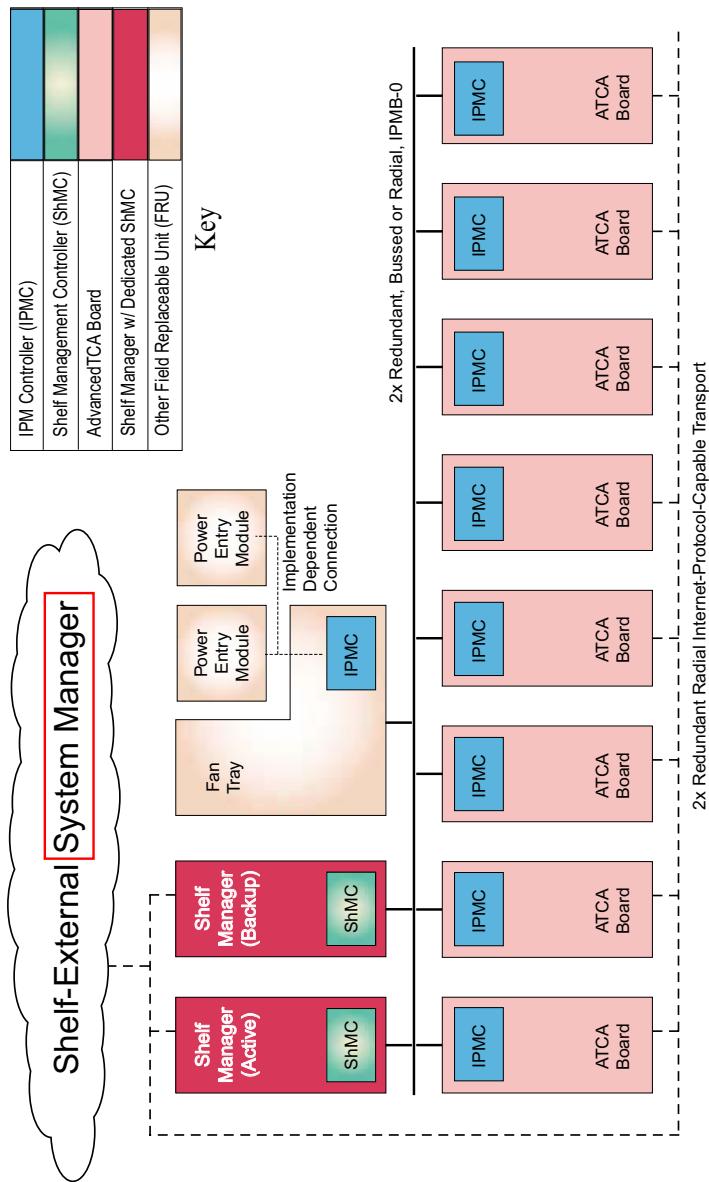
# 1.2 Functional Block Diagram
![Based on the provided image, here is an accurate and concise description of the flowchart/block diagram:\n\n**Key**\n*   **IPM Controller (IPMC)** (Blue)\n*   **Shelf Management Controller (ShMC)** (Green)\n*   **Advanced TCA Board** (Pink)\n*   **Shelf Manager w/ Dedicated ShMC** (Red)\n*   **Other Field Replaceable Unit (FRU)** (Beige)\n\n**Labeled Blocks and Components**\n*   **Shelf-External System Manager** (Cloud shape enclosing the left side)\n*   **Shelf Manager (Active)** (Red block containing a green **ShMC**)\n*   **Shelf Manager (Backup)** (Red block containing a green **ShMC**)\n*   **Fan Tray** (Beige block)\n*   **Power Entry Module** (Beige block, appearing twice)\n*   **IPMC** (Blue block inside the cloud)\n*   **ATCA Board** (Pink block, appearing eight times in a vertical stack)\n*   **IPMC** (Blue block inside each ATCA Board)\n*   **2x Redundant, Bussed or Radial, IPMB-0** (Text next to the top four ATCA Boards)\n*   **2x Redundant Radial Internet-Protocol-Capable Transport** (Text next to the bottom four ATCA Boards)\n\n**Connections**\n*   **Implementation Dependent Connection**: A dashed line labeled with this text connects the **Power Entry Module** blocks to the **IPMC** block within the cloud.\n*   A solid line connects the **Fan Tray** to the **IPMC** block within the cloud.\n*   Dashed lines connect the **Shelf Manager (Active)** and **Shelf Manager (Backup)** blocks to the column of **ATCA Board** blocks on the right.](.atca-system-manager-50-1g008-1000-200/866ee6f5c87b419ff54ce5893061614b53d7d33707c209098f2d9b552fdcc825.jpg)

# 1.3 Specifications

The ADLINK aTCA System Manager is designed based on PICMG 3.0 Revision 2.0 AdvancedTCA® Base Specification (ECN-002).

The PICMG 3.0 core specification specifies board, backplane and shelf mechanics, power distribution and the connectivity required for system management of ATCA chassis.

The specification also defines standardized, abstracted interfaces to platform management subsystems including the definition of interfaces for extending platform management between boards within the main chassis, and between multiple chassis.

![The image shows a simple icon of a document or checklist. It features a white sheet of paper with a folded top-right corner and a thin black outline. Faint grey horizontal lines run across the lower portion of the paper, and a large, bold red checkmark is superimposed over the center.](.atca-system-manager-50-1g008-1000-200/5ac6e3279dac2abdc4a570b125775671fbb390b28c0f113aa0c0fd652896f8a1.jpg)
NOTE:

All communications are based on SNMPv2. The ADLINK aTCA System Manager does not support SNMPv1 or SNMPv3.

# 1.4 Features

The ADLINK aTCA System Manager is a full-featured user interface that incorporates web browser based protocols to deliver an easy to learn and effective user experience.

Graphical User Interface: Unlike shelf manager systems that rely on command line interfaces and CGI applications, the ADLINK aTCA System Manager is designed so users do not have to memorize IPMB addresses, sensor numbers and arbitrary command line codes. The graphical user interface (GUI) directly resembles the AdvancedTCA chassis and all functions, alarms and system data can be called and edited directly from the GUI.

Remote User Access: Because of the TCP/IP nature of the System Manager's connectivity, any authorized terminal or client may access an AdvancedTCA chassis for user flexibility, especially in co-location applications.

One Click Access: Through the GUI, by clicking on any CMM or ATCA board, a user may access that boards' information directly through a pop-up window. A short list of available System Manager functions include:

1. Sensor Data Monitor
2. Temperature/Voltage Threshold Alerts
3. Hot Swap M Status Alert
4. Platform Event Filter (PEF) Settings
5. SDR Temperature and Voltage Threshold Settings
6. CMM Control
7. ATCA Board Control
8. Fan Tray Control

# 2 Installation

This chapter introduces the hardware and software requirements of the aTCA System Manager and describes how to install the System Manager.

# 2.1 Hardware Requirements

The ADLINK aTCA System Manager is a powerful interface yet does not require a high performance computing platform on which to install or operate.

The following minimum specifications should be taken into consideration when installing the aTCA System Manager to a host computer.

CPU: 400 MHz Pentium II

Hard Drive (HD): 10.0 GB

Memory (RAM): 512 MB

Optical Drive: 24X CD-Rom

Chipset: Standard X86 Architecture

Gigabit Ethernet: One or more LAN port(s)

Graphics: VGA resolution of 800 x 600 (1024 x 768 optimal)

I/O: Standard Keyboard and Mouse

# 2.2 Software Requirements

The following software is necessary and must be installed for the ADLINK aTCA System Manager Server/Client.

# On the target server:

▶ Red Hat Linux 9.0 or Fedora Core 5
▶ GCC Compiler (installed by default with Red Hat Linux 9 or Fedora Core 5)

On Client PC: Microsoft Internet Explorer 5 or Mozilla Firefox 1 (or more recent version)

![A white document icon with a folded top-right corner and horizontal lines, marked with a large red checkmark.](.atca-system-manager-50-1g008-1000-200/d4fc1cff901b30442a93457046cfb9a5dc71f4db51aa6343c4cc6bc149a54138.jpg)
NOTE:

You MUST allow pop-up windows in your browser settings to fully access the System Manager UI.

![The image displays a white document icon with a folded top-left corner. Faint grey horizontal lines run across the lower portion, resembling text. A large, bold red checkmark is superimposed diagonally across the center of the document.](.atca-system-manager-50-1g008-1000-200/546424c7d18dcbf61bd6d30273ca195ea4f3afa20511f11bf8096c647378a46d.jpg)
NOTE:

Users wishing to install the ADLINK aTCA System Manager on other Linux distributions may do so, however, this software is only verified to properly function with Red Hat Linux 9.0 and Fedora Core 5. Installing on other Linux distributions is not supported in this documentation and the user should have advanced knowledge of the Linux fundamentals to use the aTCA System Manager with a non-supported Linux distribution.

# 2.3 Installing Red Hat Linux 9

Power on the computer and insert the first installation disc into the CD or DVD drive. A boot screen appears, with a boot: prompt at the bottom.

Press &lt; Enter &gt; to install in graphical mode.

![The image displays a graphic of a white document or sheet of paper with a folded upper-left corner. Faint gray horizontal lines run across the paper, suggesting a list or text. A large, bold red checkmark is superimposed diagonally over the center of the document.](.atca-system-manager-50-1g008-1000-200/8f22cd03bdfbc7ca3d5d6c88205a32561effb52cf52a902190d02ecf7f7c31a0.jpg)
NOTE:

Red Hat Linux 9 may be installed without a CD using NFS, FTP or HTTP online server support. To view alternative installation instructions please refer to the Red Hat Linux 9 online user's manual: http://www.redhat.com/docs/manuals/linux/

![The image is a vertical crop featuring two circular character portraits stacked one above the other against a dark blue background.\n\nThe top portrait shows a red face wearing a red fedora-style hat. It has a prominent black nose.\nThe bottom portrait, positioned directly beneath the red face, shows a white face, also featuring a black nose.\n\nBlack vertical bars frame the left and right edges of the image. There is no text visible in the image.](.atca-system-manager-50-1g008-1000-200/144addc19b901603a5d5ff5a5ed7e36fe77435a73005cb1e3ff6d178d5cf7d3b.jpg)

# redhat.

# Red Hat Linux ⑨

- To install or upgrade Red Hat Linux in graphical mode, press the &lt;ENTER&gt; key.
- To install or upgrade Red Hat Linux in text mode, type: linux text &lt;ENTER&gt;.
- Use the function keys listed below for more information.
[F1-Main] [F2-Options] [F3-General] [F4-Kernel] [F5-Rescue]
boot: \_

![The image displays an icon of a white document sheet with a folded top-right corner. Faint horizontal grey lines run across the paper. Superimposed over the center is a large, bold red checkmark angled from the bottom left to the top right.](.atca-system-manager-50-1g008-1000-200/221b13983eea8d7beb3286596ee175f62c91a2bcdf1a0f1c852afcaa40982ae6.jpg)
NOTE:

The install procedure for Red Hat 9 on X86 computers has many features and options for configuring and optimizing the system. This manual only overviews the key steps to installing the appropriate software environment for use with the ADLINK aTCA System Manager. Please refer to the Red Hat Linux x86 Installation Guide for detailed Linux installation instructions.

At the Installation Type screen, select &lt;Custom&gt;.

![The image displays a cropped section of a cartoon or anime-style illustration. On the right side, there is a red shape resembling a hat or helmet with a black rim. Below the red shape is a white area, likely a face or neck, separated by a thick black outline. To the left, a dark black shape is visible against a light background.](.atca-system-manager-50-1g008-1000-200/d9a83d1294de947908194e0fa2d6001e3207d1508cb26b99a97931ba184ac5c8.jpg)

# redhat.

# Online Help

# Installation Type

Choose the type of installation that will best meet your needs.

An installation will destroy any previously saved information on the selected partitions.

For more information concerning the differences among these installation classes, refer to the Red Hat Linux Installation Guide.

# Installation Type

![The image displays a computer monitor with a grey frame. On the screen, there is a blue square containing a red circle. To the left of the monitor is a white circle, and to the right is a vertical white bar. There is no text in the image.](.atca-system-manager-50-1g008-1000-200/adbb79f42803b6909ce649ea71d228424e27fd412bda61891e0774f07c288c58.jpg)

# Personal Desktop

Perfect for personal computers or laptops, select this installation type to install a graphical desktop environment and create a system ideal for home or desktop use.

![The image is a low-resolution, pixelated illustration of a computer monitor. On the screen, there is a small picture of a person with dark hair. To the left of the monitor is a small circle, and to the right is a partial view of another white object.](.atca-system-manager-50-1g008-1000-200/cfbc43b01d9107f7e0aea0d43cd9762ac6cfe935c1662ce33346898505f5b76b.jpg)

# Workstation

This option installs a graphical desktop environment with tools for software development and system administration.

![This image features three distinct icons arranged horizontally on a plain white background. From left to right, there is a simple white circle with a thin black outline. Next to it is a globe depicting blue oceans and green landmasses. Finally, on the far right, is a white computer tower or server case standing upright with horizontal lines suggesting drive bays.](.atca-system-manager-50-1g008-1000-200/5a12778a5b5443cac155faed47db143cdbb9b61730303457160cb4ffe375c9ce.jpg)

# Server

Select this installation type if you would like to set up file sharing, print sharing, and Web services. Additional services can also be enabled, and you can choose whether or not to install a graphical environment.

![The image displays a selected radio button, characterized by a solid blue dot inside a circle on the left side. To its right is a graphic icon depicting a computer monitor with a white document on its screen. In front of the monitor sits a tan-colored tray or box containing a stack of white papers.](.atca-system-manager-50-1g008-1000-200/c881b9779c12f81e57fa5b6d34a579bcaadf80bc2e97ef39a248ac55412b468b.jpg)

# Custom

Select this installation type to gain complete control over the installation process, including software package selection and authentication preferences.

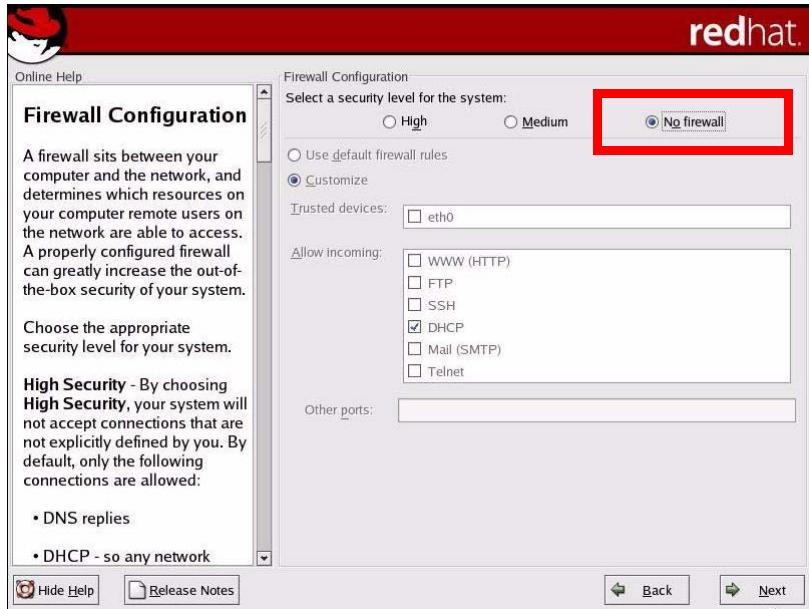
At the Firewall screen you will be given several choices.

If you are not familiar with Firewall configuration choose

&lt;No Firewall&gt;.

![redhat.\nOnline Help\nFirewall Configuration\nA firewall sits between your computer and the network, and determines which resources on your computer remote users on the network are able to access. A properly configured firewall can greatly increase the out-of-the-box security of your system.\nChoose the appropriate security level for your system.\nHigh Security - By choosing High Security, your system will not accept connections that are not explicitly defined by you. By default, only the following connections are allowed:\n• DNS replies\n• DHCP - so any network\nFirewall Configuration\nSelect a security level for the system:\n○ High ○ Medium ● No firewall\n○ Use default firewall rules\n● Customize\nTrusted devices: □ eth0\nAllow incoming: □ WWW (HTTP)\n□ FTP\n□ SSH\n☑ DHCP\n□ Mail (SMTP)\n□ Telnet\nOther ports:\nHide Help Release Notes Back Next](.atca-system-manager-50-1g008-1000-200/b4a72f02c7a1d8b77705651afaf26434796789c11e66f019590c02b8f5ad250d.jpg)

If you are experienced with Firewall setup and configuration, set your appropriate security level and open port(s):

80 tcp/udp

161 tcp/udp

162 udp

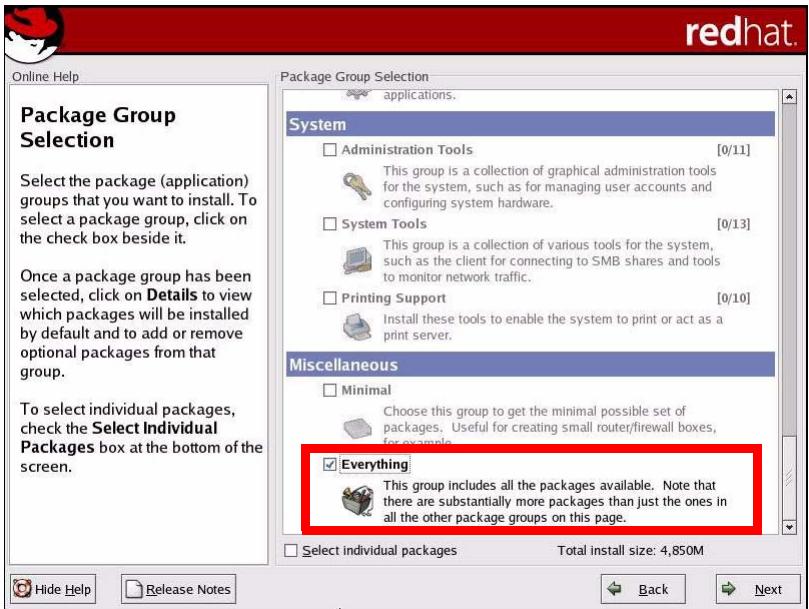
At the Package Group Selection screen, under the Miscellaneous option, select &lt; Everything &gt;.

![Package Group Selection\nSelect the package (application)\ngroups that you want to install. To\nselect a package group, click on\nthe check box beside it.\nOnce a package group has been\nselected, click on Details to view\nwhich packages will be installed\nby default and to add or remove\noptional packages from that\ngroup.\nTo select individual packages,\ncheck the Select Individual\nPackages box at the bottom of the\nscreen.\nPackage Group Selection\napplications.\nSystem\nAdministration Tools (0/11)\nThis group is a collection of graphical administration tools\nfor the system, such as for managing user accounts and\nconfiguring system hardware.\nSystem Tools (0/13)\nThis group is a collection of various tools for the system,\nsuch as the client for connecting to SMB shares and tools\nto monitor network traffic.\nPrinting Support (0/10)\nInstall these tools to enable the system to print or act as a\nprint server.\nMiscellaneous\nMinimal\nChoose this group to get the minimal possible set of\npackages. Useful for creating small router/firewall boxes,\nfor example.\nEverything\nThis group includes all the packages available. Note that\nthere are substantially more packages than just the ones in\nall the other package groups on this page.\nSelect individual packages Total install size: 4,850M\nHide Help Release Notes Back Next](.atca-system-manager-50-1g008-1000-200/fd57a8afa7258f40a7db3d4c16f62521e6195bff4a556efde0c51cce8ff5340d.jpg)

The Package Group Selection screen completes the steps critical for installation of the ADLINK aTCA System Manager. Complete the rest of the Red Hat Linux 9 installation process and then go to Section 2.5 Installing aTCA System Manager Software on page 16 to continue the installation procedure.

# 2.4 Installing Fedora Core 5

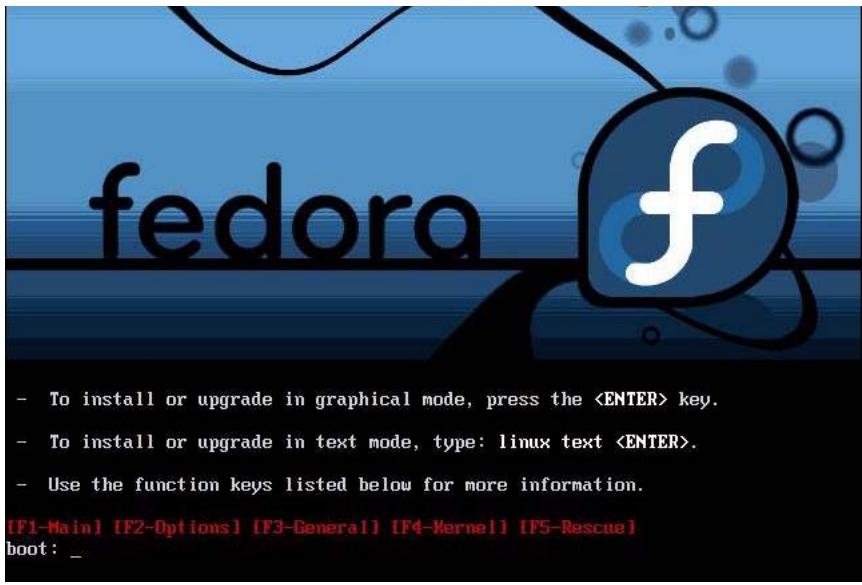
Power on the computer and insert the first installation disc into the CD or DVD drive. A boot screen appears, with a boot: prompt at the bottom.

Press &lt; Enter &gt; to install in graphical mode.

![The image displays an icon of a piece of paper with a folded upper-left corner. The paper has faint horizontal lines running across it. Overlaid on the paper is a large, bold, red checkmark that extends from the bottom left towards the top right.](.atca-system-manager-50-1g008-1000-200/bb567aaf9b0a593df1e8f26605a3d24775e74dfbe73737f93abe3d62d3c62c10.jpg)
NOTE:

Fedora Core 5 may be installed without a CD using server support. To view alternative installation instructions please refer to the Fedora Core 5 online installation guide: http://docs.fedoraproject.org/install-guide/
![- To install or upgrade in graphical mode, press the (ENTER) key.\n- To install or upgrade in text mode, type: linux text (ENTER).\n- Use the function keys listed below for more information.\n(F1-Main) (F2-Options) (F3-General) (F4-Kernel) (F5-Rescue)\nboot: _](.atca-system-manager-50-1g008-1000-200/d18aa19eeb0e3769a851c2fc7923f9fb8f5648cdb8b8270a1c5f1ba140855307.jpg)

![The image displays a white document icon with a folded top-left corner. Faint grey horizontal lines run across the page to suggest text. A large, bold red checkmark is superimposed over the center of the document.](.atca-system-manager-50-1g008-1000-200/3eca2304c9538168bdcf3657b162205606604411dda3585f9a5f6c2be43bd640.jpg)
NOTE:

The installation procedure for Fedora Core 5 on X86 computers has many features and options specifically for configuring and optimizing the system. This manual only covers the key steps to installing Fedora Core 5 for use with the ADLINK aTCA System Manager. Please refer to the Fedora Core 5 Installation Guide for detailed Linux installation instructions.

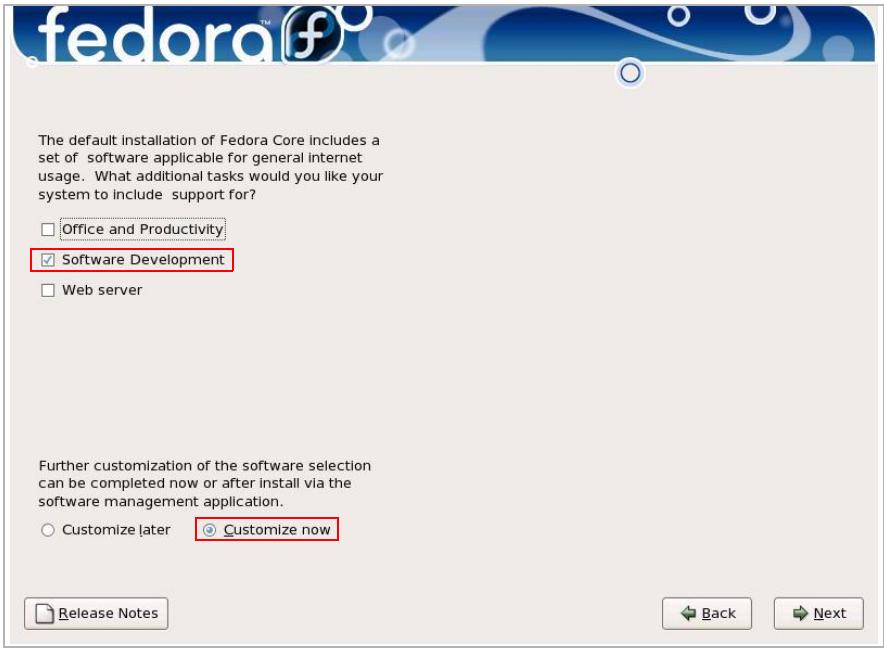
At the Installation screen, select &lt; Software Development &gt; and &lt; Customize Now &gt;.

![The default installation of Fedora Core includes a set of software applicable for general Internet usage. What additional tasks would you like your system to include support for?\nOffice and Productivity\nSoftware Development\nWeb server\nFurther customization of the software selection can be completed now or after install via the software management application.\nCustomize later Customize now\nRelease Notes Back Next](.atca-system-manager-50-1g008-1000-200/7e3008c1996fb9f893980ed75a4c55ef5bb71cfb25a5190907a00f8ce75751e1.jpg)

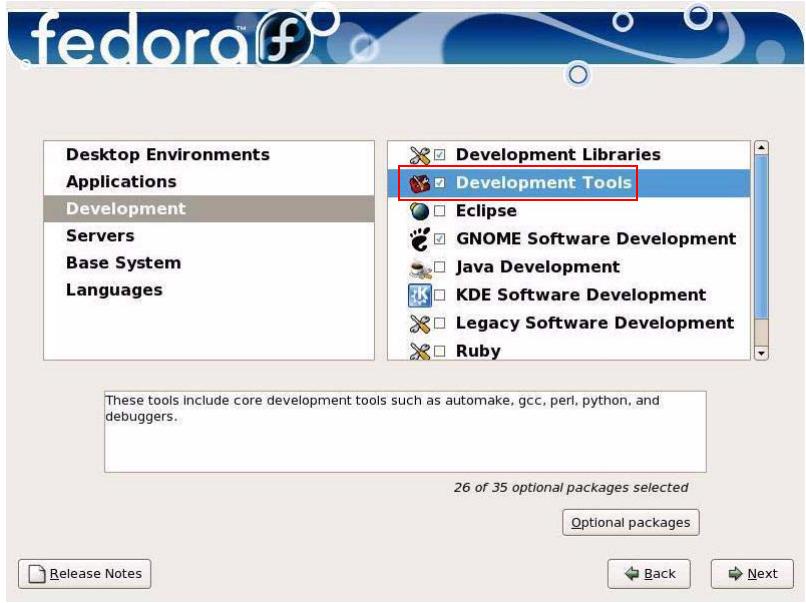
At the Optional Packages screen, under the Development option, select &lt;Development Tools&gt;.

![Desktop Environments\nApplications\nDevelopment\nServers\nBase System\nLanguages\nDevelopment Libraries\nDevelopment Tools\nEclipse\nGNOME Software Development\nJava Development\nKDE Software Development\nLegacy Software Development\nRuby\nThese tools include core development tools such as automake, gcc, perl, python, and debuggers.\n26 of 35 optional packages selected\nOptional packages\nRelease Notes\nBack\nNext](.atca-system-manager-50-1g008-1000-200/7c42c4bc856263311f09f06ac3be29126b3244f10bed7c23866b121bc8ddb348.jpg)

Continue the setup process and complete installation of the remaining Fedora Core 5 components.

After installation you must re-boot the system and you will be asked to select several additional configuration settings. At the welcome screen you will be asked to review the license agreement.

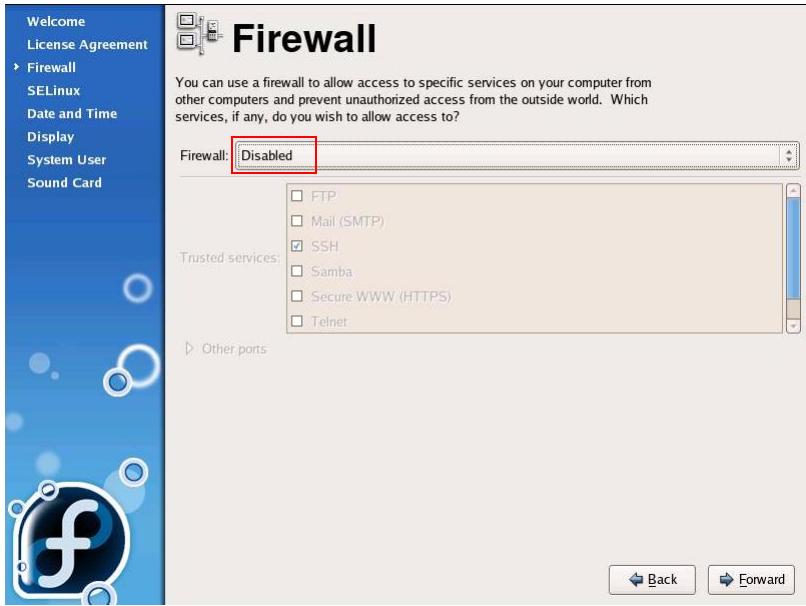
At the Firewall screen, select &lt;Disabled&gt;.

![Welcome\nLicense Agreement\n▶ Firewall\nSELinux\nDate and Time\nDisplay\nSystem User\nSound Card\nFirewall\nYou can use a firewall to allow access to specific services on your computer from\nother computers and prevent unauthorized access from the outside world. Which\nservices, if any, do you wish to allow access to?\nFirewall: Disabled\nTrusted services:\nFTP\nMail (SMTP)\nSSH\nSamba\nSecure WWW (HTTPS)\nTelnet\nOther ports\nBack Forward](.atca-system-manager-50-1g008-1000-200/52f6fb65029b7b58a4a03519f24ccc20c0081720c78c9b139c79ed83bcb6fb25.jpg)

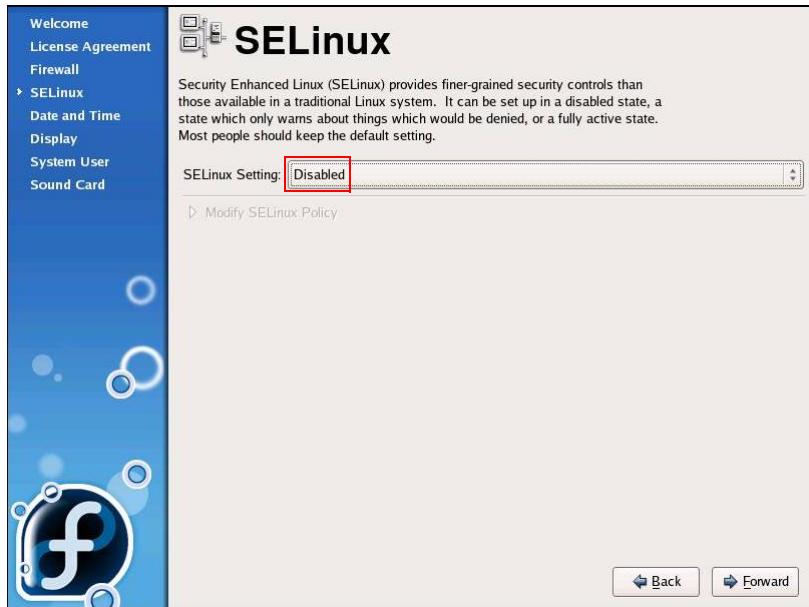
At the SELinux (Security Enhanced) screen, select &lt; Disabled &gt;.

![Welcome\nLicense Agreement\nFirewall\nSELinux\nDate and Time\nDisplay\nSystem User\nSound Card\nSELinux\nSecurity Enhanced Linux (SELinux) provides finer-grained security controls than those available in a traditional Linux system. It can be set up in a disabled state, a state which only warns about things which would be denied, or a fully active state.\nMost people should keep the default setting.\nSELinux Setting: Disabled\nModify SELinux Policy\nBack	Forward](.atca-system-manager-50-1g008-1000-200/21e14bca7c6d0cef367603a5900c3443f44dfb27403287cef1918532a10e7271.jpg)

The SELinux screen completes the steps critical for installation of the ADLINK aTCA System Manager. Complete the rest of the Fedora Core 5 installation process and then go to Section 2.5 Installing aTCA System Manager Software on page 16 to continue the installation procedure.

# 2.5 Installing aTCA System Manager Software

Once you have installed and configured either Red Hat Linux 9 or Fedora Core 5, you may begin installation of the ADLINK aTCA System Manager Software.

The System Manager installation procedure is outlined as follows:

1. Install ADLINK aTCA System Manager package, including:

▷ tools-[date].tgz
▷ system\_manager\_vx.x.tgz

2. Reboot the target server

The detailed installation procedure is described below.

# 2.5.1 Installing to a New Copy of Linux

Download the ADLINK aTCA System Manager Installation software from our company website at: http://www.adlinktech.com/ccps/system\_manager.html

The system manager software package include two compressed files. Please download tools-[date].tgz and system\_manager\_vx.x.tgz from from the website.

At the Linux command prompt, perform the following steps:

1. Login as root
2. Place these two compress files in the /tmp/ directory
3. Please install tools-[date].tgz first
4. Then install system\_manager\_Vx.xtgz

# Install Tools

At the Linux command prompt, perform the following steps:

```shell
#tar zxvf tools-[date].tgz
#cd tools
#./install.sh
```

All necessary tools for the system manager will be automatically installed. The total installation process may take up to 30 minutes and requires user attention.

When the system is ready to compile the net-snmp package, it will prompt you to answer several questions to complete the system configuration.

Press &lt; Enter &gt; or &lt; Return &gt; to continue at the command prompt.

The setup and configuration process should resemble the following text:

```txt
checking for ipstat.ips_cantforward... no
checking for ipstat.ips_cantfrag... no
checking for ipstat.ips_delivered... no
checking for ipstat.ips_fragdropped... no
checking for ipstat.ips_fragtimeout... no
checking for ipstat.ips_fragmented... no
checking for ipstat.ips_localout... no
checking for ipstat.ips_noproto... no
checking for ipstat.ips_noroute... no
checking for ipstat.ips_odropped... no
checking for ipstat.ips_ofragments... no
checking for ipstat.ips_reassembled... no
checking for des_ks_struct.weak_key... no
checking if sysctl can read kernel information... no
checking whether TCP timers depend on 'hz'... no
checking if you have run configure before...
*************************** Configuration Section ***************************
```

You are about to be prompted with a series of questions. Answer them carefully, as they determine how the SNMP agent and related applications are to function.

After the configure script finishes, you can browse the newly created config.h file for further - less important - parameters to modify. Be careful if you re-run configure though, since config.h will be overwritten.

-Press return to continue-
disabling above prompt for future runs... yes
checking Default version of SNMP to use...

\*\*\* Default SNMP Version:

Starting with Net-SNMP 5.0, you can choose the default version of the SNMP protocol to use when no version is given explicitly on the command line, or via an 'snmp.conf' file. In the past this was set to SNMPv1, but you can use this to switch to SNMPv3 if desired. SNMPv3 will provide a more secure management environment (and thus you're encouraged to switch to SNMPv3), but may break existing scripts that rely on the old behaviour. (Though such scripts will probably need to be changed to use the '-c' community flag anyway, as the SNMPv1 command line usage has changed as well.).

At this prompt you can select "1", "2" (for SNMPv2c), or "3" as the default version for the command tools (snmpget, ...) to use. This can always be overridden at runtime using the -v flag to the tools, or by using the "defVersion" token in your snmp.conf file.

Default version of SNMP to use (3):

setting Default version of SNMP to use to... 3

checking System Contact Information...

\*\*\* System Contact Information:

Describes who should be contacted about the host the agent is running on. This information is available in the MIB-II tree. This can also be over-ridden using the "syscontact" syntax in the agent's configuration files.

System Contact Information (root@):

setting System Contact Information to... root@

checking System Location...

\*\*\* System Location:

Describes the location of the system. This information is available in the MIB-II tree. this can also be over-ridden using the "syslocation" syntax in the agent's configuration files.

System Location (Unknown):

setting System Location to... Unknown

checking Location to write logfile...

\*\*\* Logfile location:

Enter the default location for the snmpd agent to dump information & errors to. If not defined (enter the keyword "none" at the prompt below) the agent will use stdout and stderr instead.

(Note: This value can be over-ridden using command line options.)

Location to write logfile (/var/log/snmpd.log):

setting Location to write logfile to... /var/log/snmpd.log
checking Location to write persistent information...

\*\*\* snmpd persistent storage location:

Enter a directory for the SNMP library to store persistent data in the form of a configuration file. This default location is different than the old default location (which was for ucd-snmp). If you stay with the new path, I'll ask you in a second if you wish to copy your files over to the new location (once only). If you pick some other path than the default, you'll have to copy them yourself. There is nothing wrong with picking the old path (/var/ucd-snmp) if you'd rather.

Location to write persistent information (/var/net-snmp):

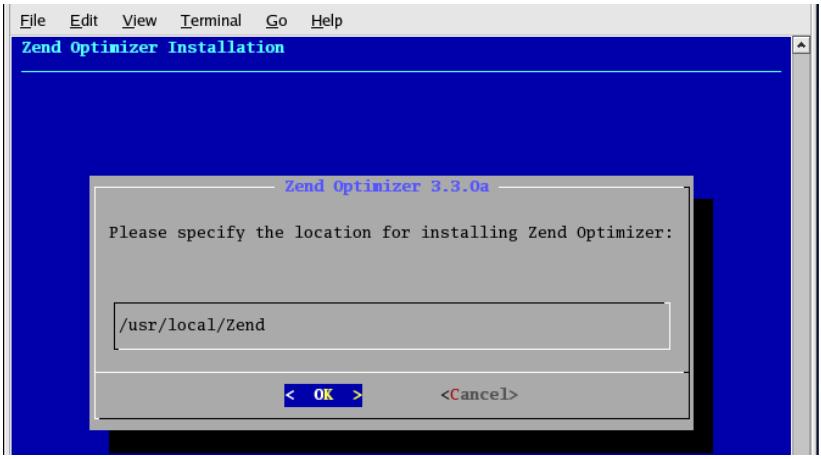
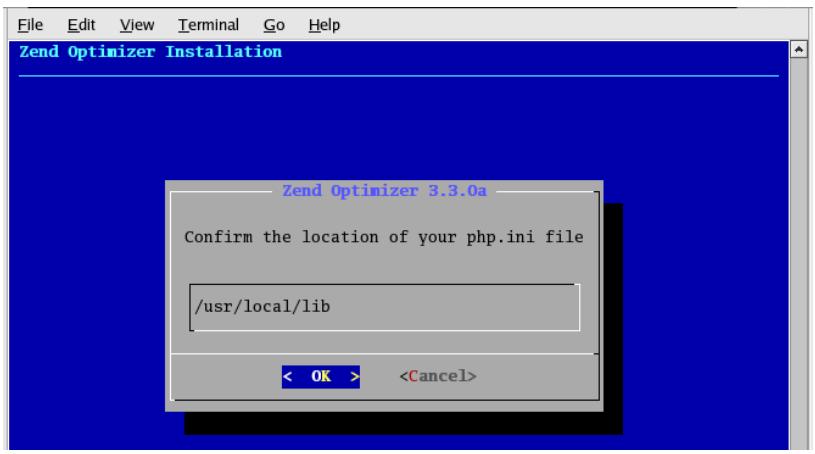
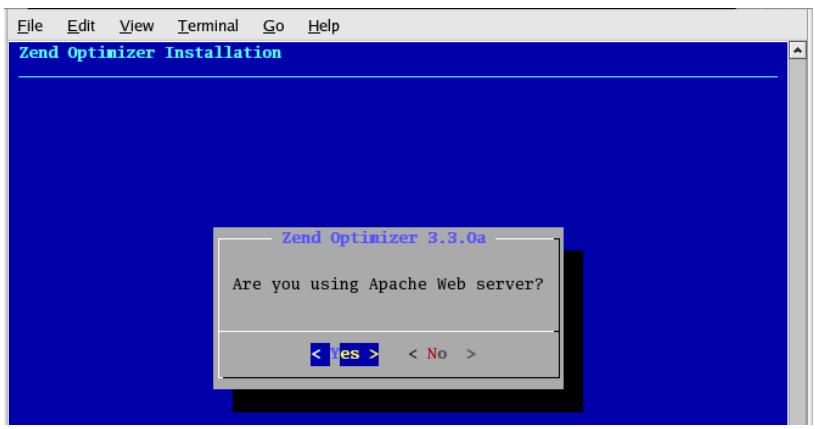
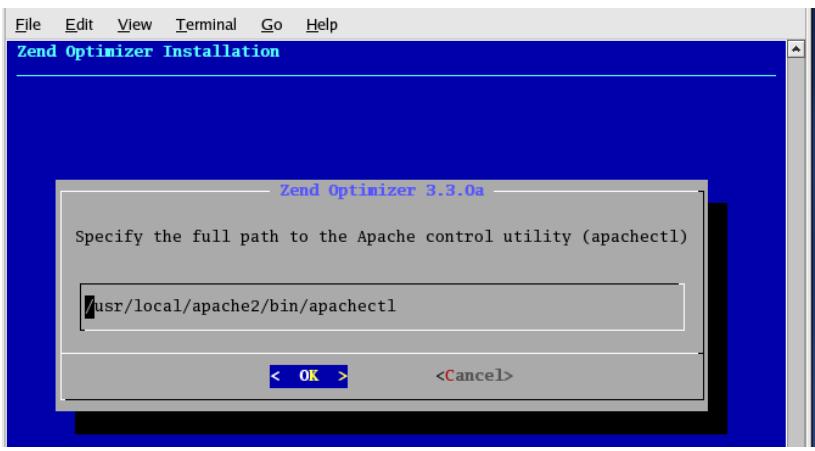
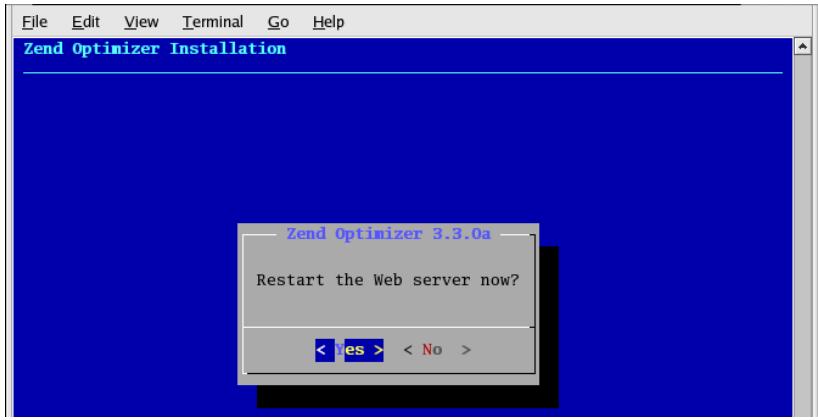
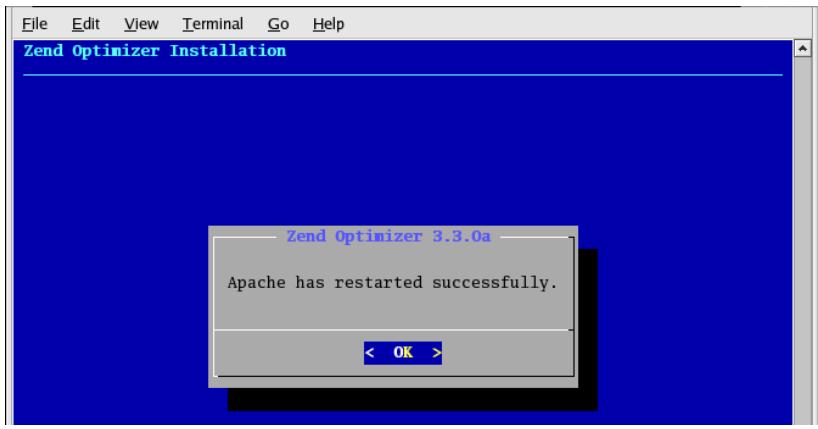
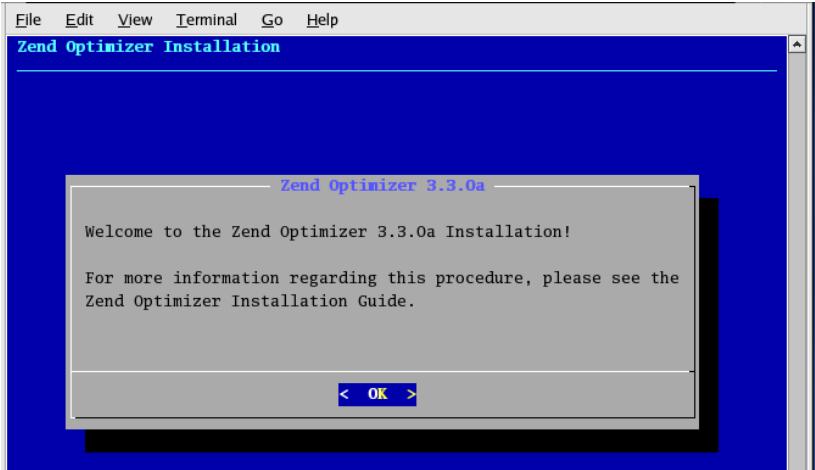
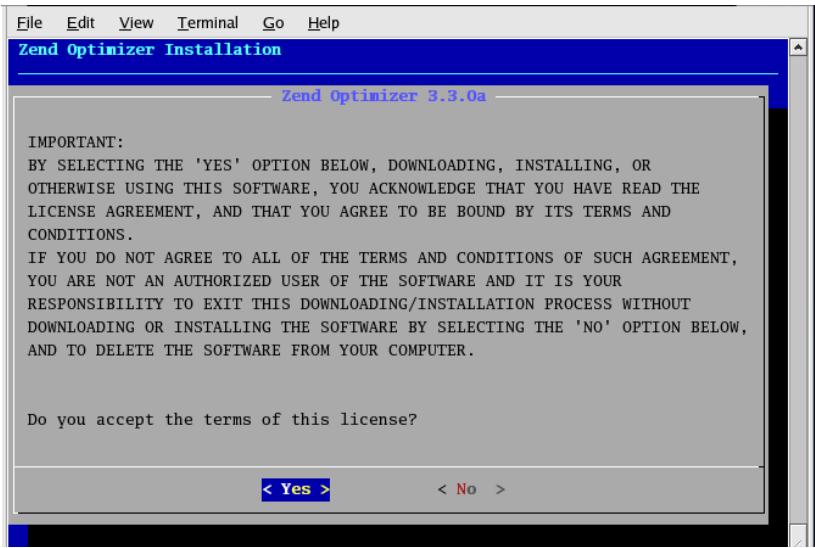
Depending on your system hardware performance, the remaining installation may take several more minutes. Several additional software packages will automatically install on your system followed by the Zend Optimizer™ installation. Follow the on-screen instructions to complete these processes.
![File Edit View Terminal Go Help\nZend Optimizer Installation\nZend Optimizer 3.3.0a\nWelcome to the Zend Optimizer 3.3.0a Installation!\nFor more information regarding this procedure, please see the\nZend Optimizer Installation Guide.\n( OK )](.atca-system-manager-50-1g008-1000-200/dabb2a9dbd39c9646d7a9dc95c48146ad3b62f9143ec4d95a661badbb756719e.jpg)

![File Edit View Terminal Go Help\nZend Optimizer Installation\nZend Optimizer 3.3.0a\nIMPORTANT:\nBY SELECTING THE 'YES' OPTION BELOW, DOWNLOADING, INSTALLING, OR\nOTHERWISE USING THIS SOFTWARE, YOU ACKNOWLEDGE THAT YOU HAVE READ THE\nLICENSE AGREEMENT, AND THAT YOU AGREE TO BE BOUND BY ITS TERMS AND\nCONDITIONS.\nIF YOU DO NOT AGREE TO ALL OF THE TERMS AND CONDITIONS OF SUCH AGREEMENT,\nYOU ARE NOT AN AUTHORIZED USER OF THE SOFTWARE AND IT IS YOUR\nRESPONSIBILITY TO EXIT THIS DOWNLOADING/INSTALLATION PROCESS WITHOUT\nDOWNLOADING OR INSTALLING THE SOFTWARE BY SELECTING THE 'NO' OPTION BELOW,\nAND TO DELETE THE SOFTWARE FROM YOUR COMPUTER.\nDo you accept the terms of this license?\n( Yes ) ( No )](.atca-system-manager-50-1g008-1000-200/5d82eeb5921264d8b5eeed0bfb60e9ce75ffba7432c4d6602ffb50c68ace5e02.jpg)

![File Edit View Terminal Go Help\nZend Optimizer Installation\nZend Optimizer 3.3.0a\nPlease specify the location for installing Zend Optimizer:\n/usr/local/Zend\n( OK )\n(Cancel)](.atca-system-manager-50-1g008-1000-200/5e6fb2ef3ab5ace8f6d6e84462ad38caec5be157ca1e483be85a750b8a6307b4.jpg)

![File Edit View Terminal Go Help\nZend Optimizer Installation\nZend Optimizer 3.3.0a\nConfirm the location of your php.ini file\n/usr/local/lib\n( OK ) (Cancel)](.atca-system-manager-50-1g008-1000-200/03a0d312ea3f9c2c336d4ac097f21e32da2ef9a9bc3815660307325e2a6eb6b5.jpg)

![File Edit View Terminal Go Help\nZend Optimizer Installation\nZend Optimizer 3.3.0a\nAre you using Apache Web server?\n( Yes ) ( No )](.atca-system-manager-50-1g008-1000-200/1593521402b92bb1db43b91c28de430ffb6027f95e2c3b96ff4898a9f387b7c5.jpg)

![File Edit View Terminal Go Help\nZend Optimizer Installation\nZend Optimizer 3.3.0a\nSpecify the full path to the Apache control utility (apachectl)\n/usr/local/apache2/bin/apachectl\n( OK ) (Cancel)](.atca-system-manager-50-1g008-1000-200/22ad2925a885ec9392087e39e06bd21cbd12caea6b3dcda0e02816d0f03577f5.jpg)

![File Edit View Terminal Go Help\nZend Optimizer Installation\nZend Optimizer 3.3.0a\nRestart the Web server now?\n( Yes ) ( No )](.atca-system-manager-50-1g008-1000-200/62f885ea1b01971710c24e480dcf8a0c76a06ef72594b1541987fe76eb731aba.jpg)

![File Edit View Terminal Go Help\nZend Optimizer Installation\nZend Optimizer 3.3.0a\nApache has restarted successfully.\n( OK )](.atca-system-manager-50-1g008-1000-200/7fc83a40e13cea7da952547925927461959e2ea342a0f2f244836edfe919f6d9.jpg)

# Install System Manager

After all necessary tools are installed, please install the aTCA System Manager.

At the Linux command prompt, perform the following steps:

```shell
#tar zxvf system_manager_vx.x.tgz
#cd /tmp/system_manager_vx.x/
# ./install.sh
```

The script &lt; install.sh &gt; will provide 2 options: Option 1 installs the system manager, and Option 2 will exit. Please select Option 1 and press Enter. It will auto install the aTCA System Manager and all its associated components to your Linux operating system.
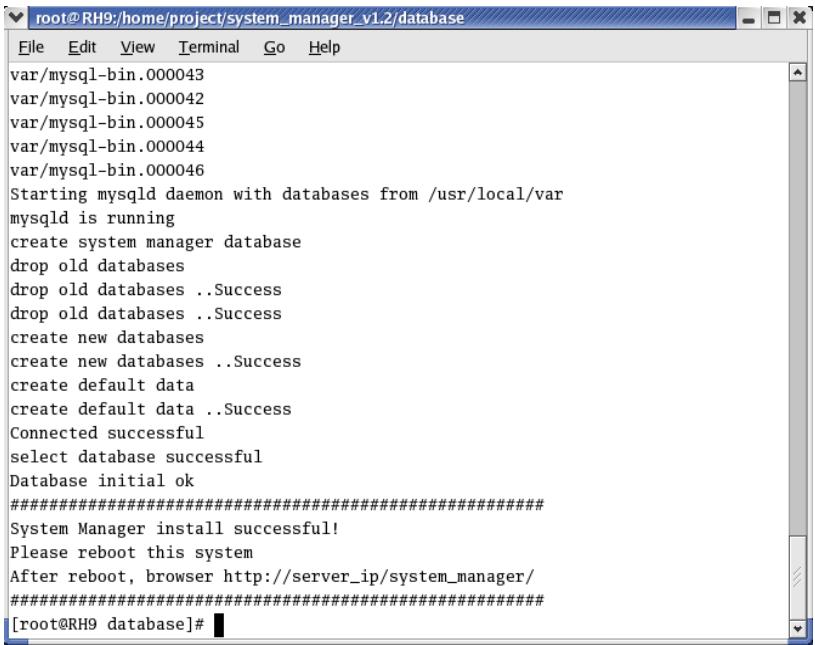
![root@RH9:/home/project/system_manager_v1.2/database\nFile Edit View Terminal Go Help\nvar/mysql-bin.000043\nvar/mysql-bin.000042\nvar/mysql-bin.000045\nvar/mysql-bin.000044\nvar/mysql-bin.000046\nStarting mysqld daemon with databases from /usr/local/var\nmysqld is running\ncreate system manager database\ndrop old databases\ndrop old databases ..Success\ndrop old databases ..Success\ncreate new databases\ncreate new databases ..Success\ncreate default data\ncreate default data ..Success\nConnected successful\nselect database successful\nDatabase initial ok\n###########\nSystem Manager install successful!\nPlease reboot this system\nAfter reboot, browser http://server_ip/system_manager/\n###########\n(root@RH9 database)#](.atca-system-manager-50-1g008-1000-200/d3c32a98dd606aaaec9431745cb26f35333c95bff19a726960957c022c733abf.jpg)

After the installation is complete, you must verify your MySQL and SNMP packages; please go to Section 2.6 Verifying MySQL and SNMP Packages on page 28 to continue.

# 2.5.2 Installing to an Existing Copy of Linux

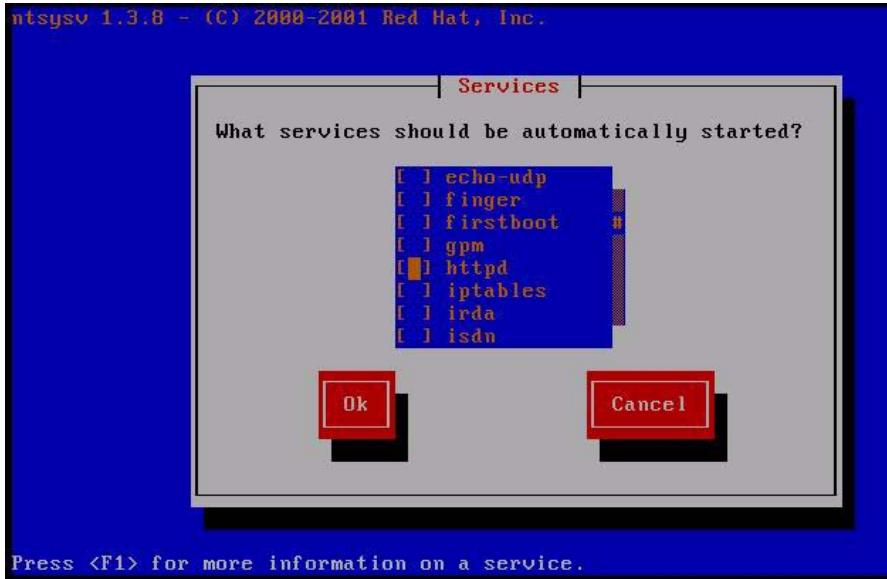
Before you can install the ADLINK aTCA System Manager to an existing copy of Red Hat 9, Fedora Core 5, be sure to configure your system by turning off the &lt;httpd&gt; and &lt;mysql&gt; services manually through the &lt;ntsysv&gt; utility.

Both the &lt;httpd&gt; and &lt;mysql&gt; services are "Automatically Started" by default and may cause installation errors for the ADLINK aTCA System Manager software packages.

At the Linux command prompt, with root access, type:

```txt
#ntsysv
```

At the &lt;#ntsysv&gt; utility prompt, disable the &lt;httpd&gt; and &lt;mysql&gt; services.

![ntsysv 1.3.8 - (C) 2000-2001 Red Hat, Inc.\nServices\nWhat services should be automatically started?\n( ) echo-udp\n( ) finger\n( ) firstboot\n( ) gpm\n( ) httpd\n( ) iptables\n( ) irda\n( ) isdn\nOk	Cancel\nPress (F1) for more information on a service.](.atca-system-manager-50-1g008-1000-200/aa5353acbb9d655b1ba5f4c4c4f4d1dd4882897d79dbe2a07bb84809b52adae9.jpg)

After you have disabled the httpd and mysql services, you may install the ADLINK aTCA System Manager software. See Section 2.5.1 Installing to a New Copy of Linux on page 17 for details.

![The image displays a white document icon featuring horizontal gray lines and a folded top-right corner, overlaid with a large red checkmark.](.atca-system-manager-50-1g008-1000-200/55a5aedc410d3c0ec1e4b5c8ae3689318b2c424ee470c9b6a268cc66f67aea17.jpg)
NOTE:

The aTCA System Manager software has only been tested and certified for use when installed to a new copy of Red Hat 9 or Fedora Core 5 or other Linux distribution on X86 based PC's. If your installation to an existing copy of Red Hat 9 or Fedora Core 5 or other Linux distribution does not function properly, please refer to Section 2.5.1 and reinstall to a new copy of Linux.

# 2.6 Verifying MySQL and SNMP Packages

In order to complete installation of the aTCA System Manager and ensure proper communication with the chassis, you must first verify your MySQL settings and SNMP packages.

At the command prompt under root, type:

```markdown
# which mysqld_safe
```

If the installation was successful and MySQL verified, the system should respond with the following message:

```txt
/usr/local/bin/mysqld_safe
```

Verify the SNMP packages by typing:

```markdown
# which snmpget
```

The system should respond with the following message:

```txt
/usr/local/bin/snmpget
```

![The image features a white rectangular icon resembling a sheet of paper with faint horizontal lines running across it. Superimposed over the center of the paper is a large, bold red checkmark slanting upwards from left to right.](.atca-system-manager-50-1g008-1000-200/7abd05222513669c927715c58e92c306284372f28a2cbaee21f24b1c39367f70.jpg)
NOTE:

If either the MySQL or SNMP are not verified by the system, there may be an installation error. Please refer to Section 2.5 to attempt a software re-install or refer to your Linux software installation manual.

If there are no errors, then reboot your system. At the command prompt under root, type:

```txt
# sync
# sync
# reboot
```

# 2.7 Network Security

In order to take full advantage of the ADLINK aTCA System Manager, a proper network environment must be set up for the host computer (aTCA System Manager), the Shelf System, and the clients/terminals you wish to allow access to the System Manager.

![The image displays a white document icon with blue horizontal lines and a folded top-right corner. A large red checkmark is overlaid on the document.](.atca-system-manager-50-1g008-1000-200/7b4d6bd3c29caaf47ff40b2f6edebb75851fe5c610383ae2e6c38afd216f3bb5.jpg)
NOTE:

This section illustrates the possible network security options of the ADLINK aTCA System Manager. It does not cover how to setup a network, only how the network should work for users to access the System Manager User Interface remotely. Ask your network administrator for assistance in configuring advanced networking features.

The System Manager was specifically designed to be a secure and reliable platform for monitoring and configuring aTCA shelf systems. The network administrator should carefully monitor the network at all times and configure appropriate access to the shelf system.

![The image displays a document icon featuring a white page with a folded top-right corner and faint horizontal lines. A large, bold red checkmark is superimposed diagonally across the center of the page.](.atca-system-manager-50-1g008-1000-200/0a269a6154b8b565c2ad15cf19d368f76a75b27b0e1f9d569d5fc21ce3993f9b.jpg)
NOTE:

To ensure proper communication between the Shelf System and the System Manager, be sure to open the 161/udp, 161/tcp and 162/udp ports in the System Manager network configuration.

# 2.7.1 Basic Firewall Security
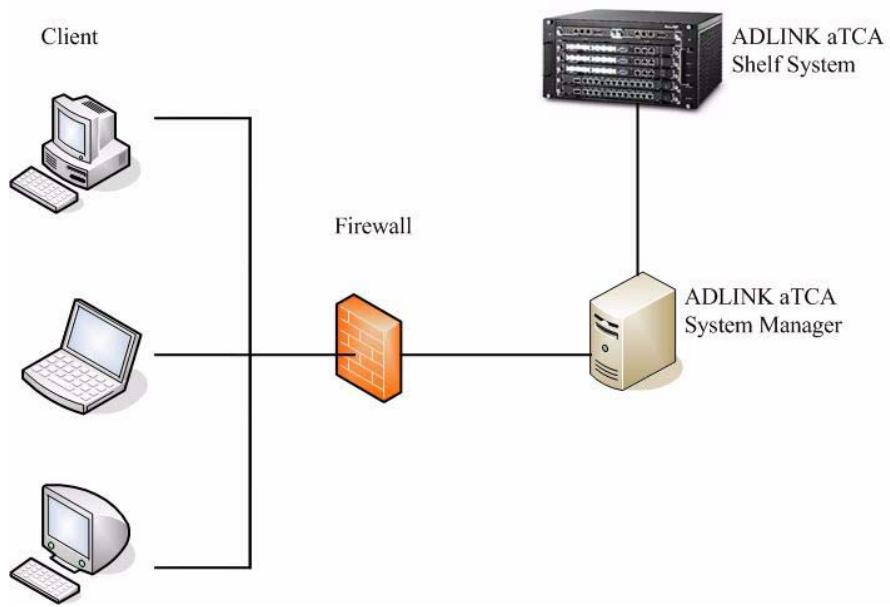
![Based on the provided image, here is the description of the flowchart:\n\n**Labeled Blocks:**\n*   **Client** (located above three computer icons: a desktop, a laptop, and a monitor/keyboard)\n*   **Firewall** (located above an orange brick icon)\n*   **ADLINK aTCA Shelf System** (located next to a server rack)\n*   **ADLINK aTCA System Manager** (located next to a computer tower)\n\n**Connections:**\n*   A large bracket groups the three computer icons under the **Client** label. A line extends from this bracket to the right, passing through the **Firewall** icon.\n*   The line continues from the **Firewall** to connect directly to the **ADLINK aTCA System Manager**.\n*   A vertical line connects the **ADLINK aTCA Shelf System** (above) down to the **ADLINK aTCA System Manager** (below).](.atca-system-manager-50-1g008-1000-200/be49c6d20e71b5e576af19f562cfa9e7945973848397587ab9ba10d6d62fe554.jpg)

This configuration only allows communication through port 80. ADLINK recommends this basic level of firewall security as a general precaution against unwanted access to the shelf system.

# 2.7.2 Optimal Firewall Security
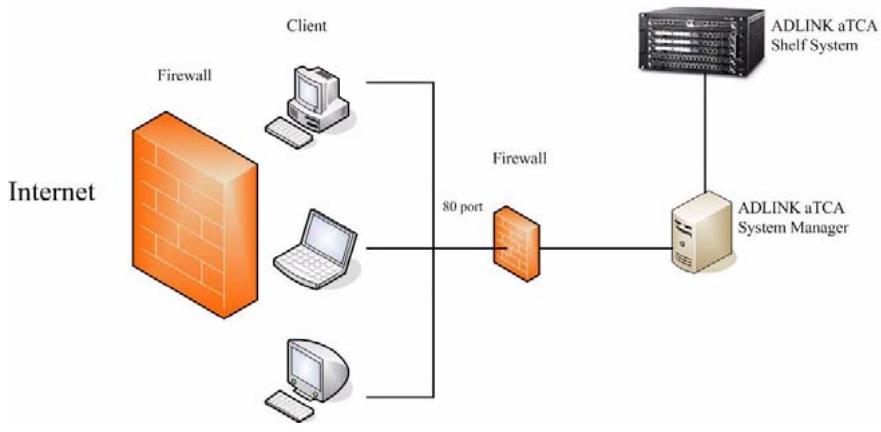
![The diagram illustrates a network architecture with the following components and connections:\n\n*   **Left Side:** The text '**Internet**' points toward a large orange brick wall labeled '**Firewall**'. To the right of this wall are three computer icons (a desktop, a laptop, and another desktop) grouped under the label '**Client**'.\n*   **Middle Connection:** A line connects the '**Client**' computers to the right, passing under the text '**80 port**' and leading into a smaller orange brick wall labeled '**Firewall**'.\n*   **Right Side:** The smaller '**Firewall**' connects via a horizontal line to a beige computer tower labeled '**ADLINK aTCA System Manager**'. Directly above this tower is a rack-mounted server unit labeled '**ADLINK aTCA Shelf System**', which is connected vertically to the '**ADLINK aTCA System Manager**'.](.atca-system-manager-50-1g008-1000-200/b43b4341c41856eabd6fd01b0c1c855446aa3afa0c728636d8fed35d47c0369d.jpg)

This example represents an optimal level of firewall security by placing at least two functional firewalls between your aTCA shelf system and the public internet.

This page intentionally left blank.

# 3 Getting Started - aTCA-8505

This chapter introduces how to start up and log into the ADLINK aTCA System Manager, the graphical user interface, and its functions. This chapter describes using the ADLINK aTCA-8505 chassis as the target system.

# 3.1 System Manager Startup

The ADLINK aTCA System Manager is designed to automatically run on the host computer when it boots. This process includes starting the web server and the Simple Network Management Protocol Trap Catcher (snmptc) daemon.

Your client computer (or remote client/terminal PC) should have a copy of Microsoft Internet Explorer 5 or Mozilla Firefox 1 installed and a monitor that supports 1024 x 768 resolution for optimal viewing.

![The image displays a white document icon with a folded top-right corner and faint horizontal lines, featuring a large red checkmark overlaid on it.](.atca-system-manager-50-1g008-1000-200/fe0b962db65fdf9c45555f8e06820ac81d3f78fb561c6ae77b06d8287d1263da.jpg)
NOTE:

The System Manager UI is optimized for viewing with Microsoft Windows based Internet Explorer 5 and Mozilla Firefox 1, and Red Hat Linux 9.0 and Fedora Core 5 based Mozilla Firefox 1. Non-supported Linux distributions and/or browsers may cause scripting bugs and are not recommended for use.

If you receive any error messages and your system does not startup normally, your snmptc daemon may not have registered the host IP. Please see Section 3.7.3 for further instructions or Chapter 5 for troubleshooting information.

# 3.2 Login

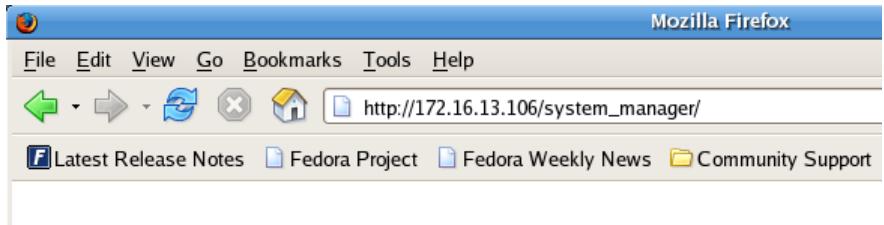
After system startup, load your client browser to access the System Manager. You should have your host computer IP address ready. At the address bar of the browser type:

```txt
http://[Host_PC_IP_Address]/system_manager/ex. http://172.16.13.106/system_manager/
```
![Mozilla Firefox\nFile Edit View Go Bookmarks Tools Help\nhttp://172.16.13.106/system_manager/\nLatest Release Notes Fedora Project Fedora Weekly News Community Support](.atca-system-manager-50-1g008-1000-200/3999d3294cb06a414618de52705dc140afda59a3afddc5a6f85ce493faba8f39.jpg)

![This is an icon of a white document with a folded top-right corner and faint gray horizontal lines. A large red checkmark is overlaid on the left side of the document.](.atca-system-manager-50-1g008-1000-200/c727de8598059dfc6274292f76a137488891e130af853565e3cfbbd530542871.jpg)
NOTE:

You must allow pop-up windows in your browser settings to fully access the System Manager UI.

The System Manager will open a new window and run the System Manager User Interface Login Screen:

![AdvancedTCA System Manager User Interface Login\nIP Address: 208.67.222.222\nAccount ID:\nPassword:\nOK Reset\nChange Password](.atca-system-manager-50-1g008-1000-200/0d0e4bfab8b14120e9ee746561959e31bf9d841a32051d9e379301a329dcc441.jpg)

Figure 3-1: Login Screen

Login with the following default account information:

IP address: [ATCA\_CMM\_IP\_Address]

Account ID: admin

Password: adminq

The system administrator may change the password settings from the user interface login screen by clicking &lt; Change Password&gt;.

After a successful login the System Manager will automatically detect your chassis type and open the Default Sensor Settings Screen.

# 3.2.1 Default Sensor Settings Screen

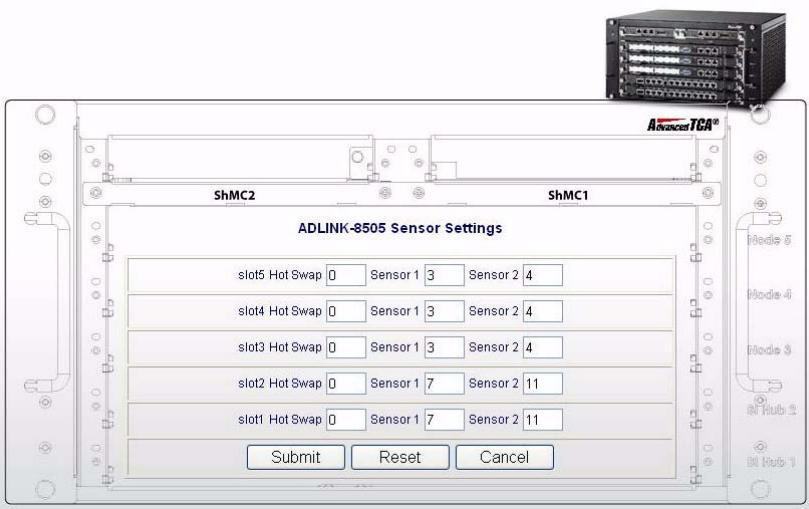
The Default Sensor Settings Screen is the initial configuration screen for your chassis and installed ATCA boards. If you have multiple chassis set up for your System Manager, the Default Sensor Settings Screen will configure and save your settings for all chassis and installed ATCA boards according to the IP address assigned to each chassis.

The Sensor Settings screen allows users to define which sensors to monitor. For each slot, the System Manager can monitor one hot swap sensor and two temperature/voltage sensors.

For detailed instructions on configuring board sensors, refer to Section 3.4.3.

![The image displays a maroon, upward-pointing triangular shape with a curved bottom edge, resembling a stylized letter 'A'. Inside the upper portion of the shape are three thin, horizontal white stripes.](.atca-system-manager-50-1g008-1000-200/099a6b10ba2f6ec7f772b9076910517dea59fc5e531af59aceab14435b8e7fef.jpg)

ADLINK

TECHNOLOGY INC.

![ADLINK-8505 Sensor Settings\nslot5 Hot Swap 0 Sensor 1 3 Sensor 2 4\nslot4 Hot Swap 0 Sensor 1 3 Sensor 2 4\nslot3 Hot Swap 0 Sensor 1 3 Sensor 2 4\nslot2 Hot Swap 0 Sensor 1 7 Sensor 2 11\nslot1 Hot Swap 0 Sensor 1 7 Sensor 2 11\nSubmit Reset Cancel](.atca-system-manager-50-1g008-1000-200/910a8aff82f9ebee44e1b6e480449dd29bb27f02c4af1ad115f1a9181ee51883.jpg)

Figure 3-2: Default Sensor Settings Screen

If this is your first time running the System Manager, leave the settings unchanged and just click &lt;Submit&gt; to proceed to the System Manager main screen. Or enter your preferred settings and click &lt;Submit&gt;. Click &lt;Reset&gt; to discard changes or click &lt;Cancel&gt; to return to the login screen.

# 3.2.2 System Manager Main Screen

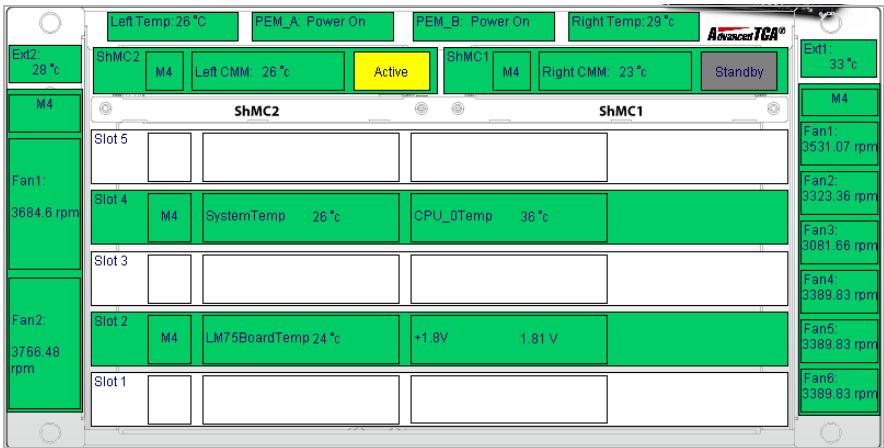
Depending on the number and type of ATCA boards and CMMs installed in your chassis, the resulting display should resemble the following:

ADLINK | About | Definitions | PEF Settings | Logout |
![| Component | Value |\n| :--- | :--- |\n| Left Temp: 26 °C |  |\n| PEM_A: Power On |  |\n| PEM_B: Power On |  |\n| Right Temp: 29 °C |  |\n| ShMC1 | M4 |\n| Right CMM: 23 °C |  |\n| Standby |  |\n| ShMC2 |  |\n| ShMC1 |  |\n| Slot 5 |  |\n| Slot 4 | M4 |\n| SystemTemp 26 °C |  |\n| CPU_0Temp 36 °C |  |\n| Slot 3 |  |\n| Slot 2 | M4 |\n| LM75BoardTemp 24 °C | +1.8V |\n| +1.8V | 1.81 V |\n| Slot 1 |  |\nActive CMM Sensor Data\n3.3 V STBY voltage 3.43 V\n3.3 V MAIN voltage 3.41 V\n+5 V voltage 5.13 V\n+12 V voltage 11.9 V\nV BAT 0.35 V\nChassis Sensor Data\nIPMB-Link IPM-A enabled, IPM-B enabled\nTelco Alarms Normal, No Alarm\nBMC Watchdog Timer expired, status only\nSystem Event System Reconfigured\nBMC Active\nEEPROM1 Active\nEEPROM2 Active\nRight Fan Tray Active\nLeft Fan Tray Active](.atca-system-manager-50-1g008-1000-200/9d94fc0a9369880d37b2dc4ecdd7b22dd89b8c182d75a5da33ec3a920878eabd.jpg)

Figure 3-3: System Manager Main Screen

# 3.3 Navigating the User Interface

The ADLINK aTCA System Manager User Interface (UI) is designed to be user friendly and visually descriptive. All areas of the user interface directly resemble their location and function in relation to the actual chassis as well as monitoring and configuration data in real time. The user interface has three major sections:

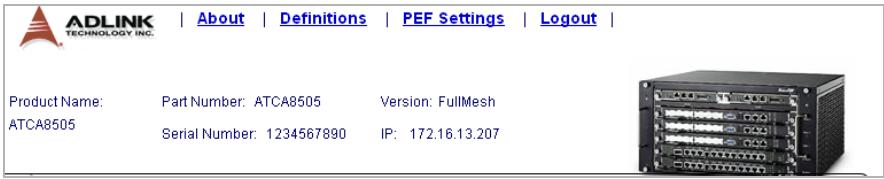
Header Section: Presents quick links, chassis hardware information, including product name, part number, serial number, version, IP address, and the chassis reference image.

![ADLINK\nTECHNOLOGY INC.\nAbout Definitions PEF Settings Logout\nProduct Name: Part Number: ATCA8505 Version: FullMesh\nATCA8505 Serial Number: 1234567890 IP: 172.16.13.207](.atca-system-manager-50-1g008-1000-200/caf6ccbb791f7d669fceb282880e118118bba42bd8f317c650ab965424402d34.jpg)

Body Section: Direct access for monitoring and control of all temperature settings, M status, board health and fan tray activity, CMM's and ATCA boards, see Figure 3-4 for the Definitions & Color Codes Screen on page 40.

![Left Temp: 26 °C\nPEM_A: Power On\nPEM_B: Power On\nRight Temp: 29 °C\nAdvanced TCA®\nExt2:\n28 °C\nShMC2\nM4\nLeft CMM: 26 °C\nActive\nShMC1\nM4\nRight CMM: 23 °C\nStandby\nM4\nShMC2\nShMC1\nFan1:\n3684.6 rpm\nSlot 5\n-\n-\n-\n-\n-\n-\n-\n-\n-\n-\n-\n-\n-\n-\n-\n-\n-\n-\n-\n-\n-\n-\n-\n-\n-\n-\n-\n-\n-\n-\n-\n-\n-\n-\n-\n-\n-\n-\n-\n-\n-\n-\n-\n-\n-\n-\n-\n-\n-\n-\n-\n-\n-\n-\n-\n-\n-\n-\n-\n-\n-\n-\n-\n-\n-\n-\n-\n-\n-\n-\n-\n-\n-\n-\n-\n-\n-\n-\n-\n-\n-\n-\n-\n-\n-\n-\n-\n-\n-\n-\n-\n-\n-\n-\n-\n-\n-\n-\n-\n-\n-33.07 rpm\nFan1:\n3531.07 rpm\nFan2:\n3323.36 rpm\nFan3:\n3081.66 rpm\nFan4:\n3389.83 rpm\nFan5:\n3389.83 rpm\nFan6:\n3389.83 rpm\nFan2:\n3766.48 rpm\nSlot 4\nM4\nSystemTemp 26 °C\nCPU_0Temp 36 °C\nSlot 3\n-\n-\n-\n-\n-\n-\n-\n-\n-\n-\n-\n-\n-\n-\n-\n-\n-\n-\n-\n-\n-\n-\n-\n-\n-\n-\n-\n-\n-\n-\n-\n-\n-\n-\n-\n-\n-\n-\n-\n-\n-\n+\n1.8V 1.81 V\nSlot 2\nM4\nLM75BoardTemp 24 °C\n+1.8V\nSlot 1](.atca-system-manager-50-1g008-1000-200/fd54cf015fc85e124577969373b4ade9d3321c04b3de0f00713849f0e2683a32.jpg)

Footer Section: Displays voltage data for CMM's, Telco Alarm, Watchdog information, and other important chassis sensor data.

<table><tr><td colspan="2">Active CMM Sensor Data</td><td colspan="5">Chassis Sensor Data</td></tr><tr><td>3.3 V STBY voltage</td><td>3.43 V</td><td>IPMB-Link</td><td>IPM-A enabled, IPM-B enabled</td><td>BMC</td><td>Active</td><td></td></tr><tr><td>3.3 V MAIN voltage</td><td>3.41 V</td><td>Telco Alarms</td><td>Normal, No Alarm</td><td>EEPROM1</td><td>Active</td><td></td></tr><tr><td>+5 V voltage</td><td>5.13 V</td><td>BMC Watchdog</td><td>Timer expired, status only</td><td>EEPROM2</td><td>Active</td><td></td></tr><tr><td>+12 V voltage</td><td>11.9 V</td><td>System Event</td><td>System Reconfigured</td><td>Right Fan Tray</td><td>Active</td><td></td></tr><tr><td>V BAT</td><td>0.35 V</td><td colspan="2"></td><td>Left Fan Tray</td><td>Active</td><td></td></tr></table>

The user interface also offers “One Click Access” allowing direct access to any CMM, ATCA or Fan Tray with the single click of a mouse.

![The image displays a pixelated, black-outlined icon of a hand with its index finger pointing upward, resembling a computer mouse cursor used to indicate a clickable link. It features a black outline against a white background.](.atca-system-manager-50-1g008-1000-200/f6077349df6b9b129e9f27fe5d1451b6b1e09860579821417a54f12bac31b186.jpg)

# 3.3.1 Quick Links

![The image displays a logo on a white background. On the left is a red triangle pointing upward, containing black horizontal lines of varying thickness. To the right of the triangle is the text 'ADLINK' in large, bold, black capital letters. Below that is the text 'TECHNOLOGY INC.' in smaller, thinner black capital letters.](.atca-system-manager-50-1g008-1000-200/76578da661d22b70fe2066c3b0328a82497c56595388a40777bac8d4f8dc6cac.jpg)

About | Definitions | PEF Settings | Logout

Click any of the quick links to view their associated information:

About: A brief overview of the System Manager

Definitions: Hardware and software sensor codes, alarms and settings (see Figure 3-4 Definitions & Color Codes Screen on page 40 for details).

PEF Settings: Hardware and software configuration/settings (see Section 3.7.1 for details).

Logout: System Logout (automatically returns users to the login screen).

![The image displays a yellow triangular warning sign with a black border set against a black background. Inside the triangle is a large black exclamation point. Below the triangle, the text 'CAUTION:' is written in black capital letters.](.atca-system-manager-50-1g008-1000-200/08a2d2a9f30df7dd31a2b588784377ff1d4737509e97611b71cb90444db00b05.jpg)

In order to avoid unauthorized access, remember to Logout when not actively configuring or monitoring the System Manager.

![The image displays a reddish-brown triangular shape pointing upward. Inside the triangle, there are three horizontal white stripes running across the middle section. The bottom edge of the triangle is slightly curved.](.atca-system-manager-50-1g008-1000-200/edbc4566860c0a72fe1ae631a0b79a239abb50f951d2f37670c2fe8eea7f98ef.jpg)

ADLINK

TECHNOLOGY INC.

[x] Close Window

# aTCA Spec Definitions

# Hot Swap (Sensor Type Code: F0h)

Current State Mask

<table><tr><td>0x0001</td><td>FRU Not Installed</td></tr><tr><td>0x0002</td><td>FRU Inactive</td></tr><tr><td>0x0004</td><td>FRU Activation Request</td></tr><tr><td>0x0008</td><td>FRU Activation In Progress</td></tr><tr><td>0x0010</td><td>FRU Active</td></tr><tr><td>0x0020</td><td>FRU Deactivation Request</td></tr><tr><td>0x0040</td><td>FRU Deactivation In Progress</td></tr><tr><td>0x0080</td><td>Communication Lost</td></tr></table>

# IPMB LINK (Sensor Type Code: F1h)

Current State Mask

<table><tr><td>0x0001</td><td>IPM-A disabled, IPM-B disabled</td></tr><tr><td>0x0002</td><td>IPM-A enabled, IPM-B disabled</td></tr><tr><td>0x0004</td><td>IPM-A disabled, IPM-B enabled</td></tr><tr><td>0x0008</td><td>IPM-A enabled, IPM-B enabled</td></tr></table>

# IPMI Specification Definitions

BMC Watchdog (Sensor Type Code: 23h)

<table><tr><td>0x0000</td><td>Timer expired, status only</td></tr><tr><td>0x0001</td><td>Hard reset</td></tr><tr><td>0x0002</td><td>Power down</td></tr><tr><td>0x0003</td><td>Power cycle</td></tr><tr><td>0x0008</td><td>Timer interrupt</td></tr></table>

System Event (Sensor Type Code: 12h)

<table><tr><td>0x0000</td><td>System reconfigured</td></tr><tr><td>0x0001</td><td>OEM system boot event</td></tr><tr><td>0x0002</td><td>Undetermined system hardware failure</td></tr><tr><td>0x0003</td><td>Entry added to auxiliary log</td></tr><tr><td>0x0004</td><td>PEF action</td></tr></table>

FRU Background Color Codes

<table><tr><td></td><td>Network Unreachable</td></tr><tr><td></td><td>Absent</td></tr><tr><td></td><td>Present and Inactive</td></tr><tr><td></td><td>Present and Active</td></tr></table>

CMM Status Color Codes

<table><tr><td></td><td>CMM Standby</td></tr><tr><td></td><td>CMM Active</td></tr></table>

Temperature / Voltage Sensor Color Codes

<table><tr><td></td><td>Non-Critical Alert</td></tr><tr><td></td><td>Critical Alert</td></tr><tr><td></td><td>Non-Recoverable Alert</td></tr></table>

Hot Swap State Color Codes

<table><tr><td></td><td>M4</td></tr><tr><td></td><td>Out of M4</td></tr></table>

Telco Alarms Color Codes

<table><tr><td></td><td>Normal</td></tr><tr><td></td><td>Alarm</td></tr></table>

# CPLD

bit[0]=1: Shelf Manager ACTIVE, NO Backup.
bit[1]=1: Shelf Manager ACTIVE, with Backup.
bit[2]=1: Shelf Manager is Backup.
bit[3]=1: Reserved bit
bit[4]=1: Shelf Manger is Backup, remote presence bit NOT SET.
bit[5]=1: Shelf Manger is Backup, remote switchover request bit NOT SET.
bit[6]=1: Shelf Manager is Backup, CPLD ACTIVE bit SET.
bit[7]=1: Shelf Manager ACTIVE, with Backup, remote presence bit NOT set.
bit[8]=1: Shelf Manager ACTIVE, with Backup, remote health bit NOT SET.
bit[9]=1: Shelf Manager ACTIVE, with Backup, CPLD ACTIVE bit NOT set.
bit[10]=1: Shelf Manager ACTIVE, NO Backup, healt bit SET.
bit[12]=1: Shelf Manager ACTIVE, NO Backup, remote switchover request bit SET.

# ADLINK OEM Definitions

OEM Reserved (Sensor Type Code: C0h-FFh)

<table><tr><td></td><td>0x0001</td><td>0x0002</td></tr><tr><td>HW Monitor SMI</td><td>Normal</td><td>Abnormal</td></tr><tr><td>HW Mon Over Temp</td><td>Normal</td><td>Abnormal</td></tr><tr><td>HW Mon WD T/out</td><td>Normal</td><td>Abnormal</td></tr><tr><td>ICH WD Timeout</td><td>Normal</td><td>Abnormal</td></tr><tr><td>CPU FERR</td><td>Normal</td><td>Abnormal</td></tr><tr><td>CPU IERR</td><td>Normal</td><td>Abnormal</td></tr><tr><td>MCH/PXH Over Temp</td><td>Normal</td><td>Abnormal</td></tr><tr><td>S5 Sleep</td><td>Normal</td><td>Abnormal</td></tr><tr><td>Payload Power OK</td><td>Abnormal</td><td>Normal</td></tr><tr><td>BIOS POST OK</td><td>Abnormal</td><td>Normal</td></tr></table>

# Telco alarms

bit[0]=1: Minor Alarm

bit[1]=1: Major Alarm

bit[2]=1: Critical Alarm

Figure 3-4: Definitions & Color Codes Screen
![The image shows a white document icon with a folded top-right corner. Faint horizontal lines run across the document, suggesting a list or text. A large, bold red checkmark is superimposed over the center of the document.](.atca-system-manager-50-1g008-1000-200/629e12840909844aee973f341787d88144a625cd74b5177dc6f16d9b51e6ad5c.jpg)
NOTE:

Please take special notice of the color codes. For example, FRU background color codes determine if a board or module is present, active, etc. These color codes allow for simple monitoring and understanding of the health and activity of your chassis.

# 3.4 ATCA Boards

There are five slots on the user interface corresponding to the five slots on the shelf that can be mounted with an ATCA board. The UI divides the board information into four areas from left to right: Slot number, M status and two configurable board sensors. Board sensors can be configured to display system temp, CPU temp, voltage, or hotswap status.

<table><tr><td>Slot 2</td><td>M4</td><td>LM75BoardTemp 24 °C</td><td>+1.8V</td><td>1.81 V</td></tr></table>

# 3.4.1 Getting ATCA Board Information

Move your cursor to any installed ATCA board. Click any area under the Slot number.

![Slot 4\nM4\nSystemTemp 26 °C\nCPU_0Temp 36 °C](.atca-system-manager-50-1g008-1000-200/79a689b229b0a3a30724d2f991dde609d3ef8696f58db90d9eba492075a9901c.jpg)

The System Manager will open a new window and display all available sensor information for the selected board.

![ADLINK\nTECHNOLOGY INC.\n(x) Close Window\nMANUFACTURER: ADLINKTechnology\nPart Number: ATCA-6890\nSerial Number: 0000000000\nVersion: 0B3-008\nIP Address: 172.16.13.207\nSlot Number: 5\nTemperature\nNo ID Value\n3 3SystemTemp 37 °C\n4 4CPU_0Temp 50 °C\n5 5CPU_1Temp 0 °C\nVoltage\nNo ID Value\n6 +3.3V 3.41 V\n7 +1.8V 1.81 V\n8 +1.5V 1.5 V\n9 +5.0V 5.15 V\nOther\nNo ID Value\n0 HotSwap 0x0010\n1 IPMBPhysical 0x0008\n2 BMCWatchdog 0x0000\n10 HWMonitorSMI 0x0001\n11 HWMonOverTemp 0x0001\n12 HWMonWDTout 0x0001\n13 ICHWDTimeout 0x0001\n14 CPUFERR 0x0001\n15 CPUIERR 0x0001\n16 MCHIPXHOverTemp 0x0001\n17 S5Sleep 0x0001\n18 PayloadPowerOK 0x0002\n19 BIOSPOSTOK 0x0002\n20 ICHTHERM 0x0001\n21 CPUThermTrip 0x0001](.atca-system-manager-50-1g008-1000-200/d4cc8999379e97771d2696e084b51a613a0f8f6ea8c71e66338f2b69bd48813a.jpg)

# 3.4.2 ATCA Board Settings

At the bottom of the board information window, there are four options allowing users to configure sensor threshold, reset the board, turn board power off, and turn board power on.

![Sensor Threshold\nBoard Reset\nBoard Power Off\nBoard Power On](.atca-system-manager-50-1g008-1000-200/e613028d48470c4b8b8722aaed6b186fcd06d53e4fd24fd4dbd96cbff12d1e1c.jpg)

Clicking the &lt; Sensor Threshold &gt; button will open a new window for threshold settings as follows:

![MANUFACTURER: ADLINKTechnology\nPart Number: ATCA-6890\nSerial Number: 0000000000\nVersion: 0B3-008\nIP Address: 172.16.13.207\nSlot Number: 5\n\nTemperature Critical Threshold\nCheck Sensor ID Lower Upper Set Lower Set Upper\nSystemTemp 0 °C 75 °C -128 °C 127 °C\nCPU_0Temp 0 °C 80 °C -128 °C 127 °C\nCPU_1Temp 0 °C 80 °C -128 °C 127 °C\nVoltage Critical Threshold\nCheck Sensor ID Lower Upper Set Lower Set Upper\n+3.3V 3.01 V 3.61 V 0 y 5.61 y\n+1.8V 1.61 V 2.01 V 0 y 3.29 y\n+1.5V 1.3 V 1.7 V 0 y 3.29 y\n+5.0V 4.62 V 5.4 V 0 y 8.01 y\nSubmit Select All/Unselect All](.atca-system-manager-50-1g008-1000-200/5130efb5a383a0a765b27969c4cfa45eb0c2c007c052a81370e985de669be3d2.jpg)

Figure 3-5: ATCA Board Sensor Settings Screen

![The image displays a graphic icon of a piece of paper, resembling a document or checklist, with faint horizontal lines. A large, bold red checkmark is superimposed over the paper, slanting upwards from left to right.](.atca-system-manager-50-1g008-1000-200/84ba479a349e5cffa9bfe53d4cdbece6922e5c581ea21d26f91bbfe389f88fd8.jpg)
NOTE:

The temperature threshold values are in degrees Celsius and their range is $-128^{\circ}C$ to $+127^{\circ}C$

![The image displays a white document icon with a folded top-right corner and horizontal lines indicating text. A large, red checkmark is superimposed over the center of the document.](.atca-system-manager-50-1g008-1000-200/69fb293e9229756bee3f149f8285887257a11db68b7ab0bc1ab4e16a02066e97.jpg)
NOTE:

All Sensor Threshold settings are temporary. When you restart/reset this board, the settings will be reset to the default settings. Only hardware providers can permanently set the sensor threshold.

Clicking the &lt; Board Reset &gt; button resets the board to the default sensor settings.

Clicking the &lt; Board Power Off &gt; button on an activated ATCA board will immediately deactivate it, and the slot color will change accordingly (see to Figure 3-4 Definitions & Color Codes Screen on page 40).

![Slot 4](.atca-system-manager-50-1g008-1000-200/48f353f245c751eb36dcd6dd0a64eb3d56df0892dfd17df0386f5101da145e36.jpg)

Clicking the &lt; Board Power On &gt; button on an inactive ATCA board will activate it.

![Slot 4\nM4\nSystemTemp 31 °C\nCPU_0Temp 44 °C](.atca-system-manager-50-1g008-1000-200/b710c7b89168e7e8d94d94d5d1474f10c86b11263a3682bc1275d29d492fcdc5.jpg)

# 3.4.3 Configuring ATCA Board Sensors

Clicking the &lt; System Temp &gt; button will open the Sensor Settings screen.

![Slot 4\nM4\nSystemTemp 26°C\nCPU_0Temp 36°C](.atca-system-manager-50-1g008-1000-200/c52d2f40f60bc6488e829b03b0c9cafb0dad20a4dc2203ebbb0d52ffc7b9556b.jpg)

![ADLINK-8505 Sensor Settings\nslot5 Hot Swap 0 Sensor 1 3 Sensor 2 4\nslot4 Hot Swap 0 Sensor 1 3 Sensor 2 4\nslot3 Hot Swap 0 Sensor 1 3 Sensor 2 4\nslot2 Hot Swap 0 Sensor 1 11 Sensor 2 8\nslot1 Hot Swap 0 Sensor 1 11 Sensor 2 8\nSubmit Reset Close](.atca-system-manager-50-1g008-1000-200/baa9697cd7747b43bfba022a96ccf04666f635e0f9293beb54160296266c33f4.jpg)

Figure 3-6: ATCA Board Sensor Configuration Screen

In order to monitor blade M status and Temperature/Voltage sensors, users must configure the appropriate sensor numbers for the blade. Each slot allows for one hot swap sensor and two temperature/voltage sensors. Please refer Section 3.4.1 above to display the sensor numbers and configure them here.

Enter your preferred settings (or leave the settings unchanged) and click &lt; Submit &gt; to return to the System Manager main screen. Click &lt; Reset &gt; to discard changes or click &lt; Close &gt; to return to the main screen.

# 3.5 Shelf Management Controller

The Shelf Management Controller (ShMC) modules on the user interface correspond to the Chassis Management Modules (CMM) installed in the chassis. They can be accessed in the same way as for ATCA boards. The UI divides the module information into four areas from left to right: Module number, M status, CPU temp sensor and board status.

![ShMC2 M4 Left CMM: 26 °C Active](.atca-system-manager-50-1g008-1000-200/4e974d2df1f8e402b2c6db38290d51b72443582387c46a23a221dad1531f082a.jpg)

# 3.5.1 Getting ShMC Module Information

Move your cursor to any installed ShMC module. Click any area under the ShMC number.

![ShMC2 M4 Left CMM: 26 °C Active](.atca-system-manager-50-1g008-1000-200/8d36784fd1897ca31136b965e18fe61822c020d340f694903d2b1d9259b9d977.jpg)

The System Manager will open a new window. It will post all sensor information of the ShMC module.

![ADLINK\nTECHNOLOGY INC.\n(×) Close Window\nMANUFACTURER: PigeonPointSystems\nProduct Name: PigeonPointSystemsShelfManager\nSerial Number: PPS0000000\nVersion: Rev1.00\nIP Address: 172.16.13.207\nTemperature\nLocalTemp 27 °C\nExt1Temp 23 °C\nExt2Temp 23 °C\nVoltage\n3.3STBYvoltage 3.43 V\n3.3MAINvoltage 3.43 V\n+5Vvoltage 5.13 V\n+12Vvoltage 11.9 V\nVBAT 3.11 V\nOther\nFRUOHOT_SWAP 0x0010\nIPMBLINK 0x0008\nPEMPWROK_A 0x0001\nPEMPWROK_B 0x0001\nPEMEXIST_A 0x0001\nPEMEXIST_B 0x0001\nCPLD 0x0002\nSensor Threshold\nReset CMM\nActivate CMM](.atca-system-manager-50-1g008-1000-200/59cf7f095e1735f444504bae2d1590c31bfe5131b8d51bcbc75c767b15da3c01.jpg)

# 3.5.2 ShMC Module Settings

At the bottom of the module information window, there are three options allowing users to configure sensor thresholds, reset the CMM, or activate the CMM.

![PEMPWROK_B 0x0001\nPEMEXIST_A 0x0001\nPEMEXIST_B 0x0001\nCPLD 0x0002\nSensor Threshold\nReset CMM\nActivate CMM](.atca-system-manager-50-1g008-1000-200/e32ff75f572f6643e94e29ffeba072f9e956ebe5164ed9e082755b77e5b13d94.jpg)

Clicking the &lt; Sensor Threshold &gt; button will open a new window for threshold settings as follows:

![The image displays a logo featuring a large, red, triangular shape with horizontal stripes that resembles the letter 'A', followed by a small black period to its lower right.](.atca-system-manager-50-1g008-1000-200/47ba7ac0a0f365b9aa2301d51f6150a7222f4d3fa495b351655255ccb86cdc2d.jpg)

ADLINK

TECHNOLOGY INC.

[x] Close Window

# Chassis Temperature Critical Threshold

<table><tr><td>Check</td><td>Sensor</td><td>Get Lower</td><td>Get Upper</td><td>Set Lower</td><td>Set Upper</td></tr><tr><td>☐</td><td>LocalTemp</td><td>-128 °C</td><td>65 °C</td><td>-128 °C</td><td>127 °C</td></tr></table>

Submit

![The image displays a simple, gray rectangular outline on a plain white background. The image is slightly blurry.](.atca-system-manager-50-1g008-1000-200/1174bc0107d101a5286518d2bcb07ecdcde38f64b2e15fcc528b1732fdaa95b5.jpg)

Select All/Unselect All

Figure 3-7: ShMC Module Sensor Settings Screen
![A white document icon with horizontal grey lines and a folded top-right corner, featuring a large red checkmark drawn over the right side.](.atca-system-manager-50-1g008-1000-200/228e006f7116e4e99d0b3fdaf39b35c6866db9f9f812e1f361a21de837e82e21.jpg)
NOTE:

The temperature threshold values are in degrees Celsius and their range is $-128^{\circ}C$ to $+127^{\circ}C$

![An icon depicting a white piece of paper with a folded top-right corner and blue horizontal lines. A large, bold red checkmark is drawn diagonally across the document.](.atca-system-manager-50-1g008-1000-200/118b4f637e5d83cfb6a4fe2e3deb7cdcceb339778b24de89f34c3ecb49631255.jpg)
NOTE:

All Sensor Threshold settings are temporary. When you reset a CMM, the settings will also be reset. Only hardware providers can permanently set the sensor threshold.

# 3.5.3 Active CMM Sensor Data

In addition to clicking on the ShMC module for detailed information, the left side footer section of the user interface also displays "Active CMM Sensor Data". This area displays real time voltage information.

<table><tr><td colspan="2">Active CMM Sensor Data</td></tr><tr><td>3.3 V STBY voltage</td><td>3.43 V</td></tr><tr><td>3.3 V MAIN voltage</td><td>3.41 V</td></tr><tr><td>+5 V voltage</td><td>5.13 V</td></tr><tr><td>+12 V voltage</td><td>11.9 V</td></tr><tr><td>V BAT</td><td>0.35 V</td></tr></table>

# 3.6 Chassis Information

Chassis information is displayed in the user interface for easy visual reference. Internal/external temperatures and power entry module information are displayed near the top of the chassis representation. Fan tray information and one click access to fan tray settings are on the right and left edges of the chassis representation. Other sensor data is displayed at the bottom edge.

![Left Temp: 26 °C\nPEM_A: Power On\nPEM_B: Power On\nRight Temp: 29 °C\nPower Entry Modules\nChassis Temperature Information\nExhaust Fan tray\nEntry Fan Tray\nEx1:\n33 °C\nM4\nFan1:\n3531.07 rpm\nFan2:\n3323.36 rpm\nFan3:\n3081.66 rpm\nFan4:\n3389.83 rpm\nFan5:\n3389.83 rpm\nFan6:\n3389.83 rpm](.atca-system-manager-50-1g008-1000-200/c40f8b921298de9d8289f0d8e43e72a6199da7cd5b6b4a58ea784a082fe85d9e.jpg)

<table><tr><td colspan="4">Chassis Sensor Data</td></tr><tr><td>IPMB-Link</td><td>IPM-A enabled, IPM-B enabled</td><td>BMC</td><td>Active</td></tr><tr><td>Telco Alarms</td><td>Normal, No Alarm</td><td>EEPROM1</td><td>Active</td></tr><tr><td>BMC Watchdog</td><td>Timer expired, status only</td><td>EEPROM2</td><td>Active</td></tr><tr><td>System Event</td><td>System Reconfigured</td><td>Right Fan Tray</td><td>Active</td></tr><tr><td></td><td></td><td>Left Fan Tray</td><td>Active</td></tr></table>

# 3.6.1 Chassis Sensor Data

Chassis sensor data is displayed for easy visual reference. If there is a Telco Alarm activated, users can quickly identify it by its error color (see Figure 3-4 for definitions and color code details).

If either ShMC has a Telco Alarm activated, users can clear the alarm by logging into the shelf manager console and typing:

#clia alarm clear

# 3.6.2 Chassis Temperature Information & Settings

The chassis temperature information is displayed in the UI and can be accessed in the same way as for ATCA boards and ShMC modules. The UI divides the chassis temperature information into four areas: Left Temp, Right Temp, Ext1 and Ext2.

![Left Temp: 26 °C\nPEM_A: Power On\nPEM\nExt2:\n28 °C\nShMC2\nM4\nLeft CMM: 26 °C\nActive\nShMC2\nFan1:\nSlot 5\nSlot 4](.atca-system-manager-50-1g008-1000-200/6c7f96bd87787de1c64d44dd833dd99bb7067bf31e765122416aa2830ef4718f.jpg)

Clicking either the Left Temp or Right Temp shaded areas will open a new window with the Chassis Temp Critical Threshold screen.

![The image displays a stylized logo resembling a red letter 'A' or a triangle pointing upward. Inside the red shape, there are four horizontal white stripes positioned in the upper half. The background is white.](.atca-system-manager-50-1g008-1000-200/54fd0c8ebb3d526c2ff756945f4ec31d28c16bcae3103d8e568a515ca135307a.jpg)

ADLINK

TECHNOLOGY INC.

[x] Close Window

Chassis Temperature Critical Threshold

<table><tr><td>Check</td><td>Sensor</td><td>Get Lower</td><td>Get Upper</td><td>Set Lower</td><td>Set Upper</td></tr><tr><td></td><td>LocalTemp</td><td>-128°C</td><td>80°C</td><td>-128°C</td><td>127°C</td></tr><tr><td></td><td>Ext1Temp</td><td>-128°C</td><td>127°C</td><td>-128°C</td><td>127°C</td></tr><tr><td></td><td>Ext2Temp</td><td>-128°C</td><td>127°C</td><td>-128°C</td><td>127°C</td></tr></table>

Submit

□ Select All/Unselect All

Figure 3-8: Chassis Temp Critical Threshold Screen

Depending on the total number of installed fan trays (Ext1 and Ext2 sensors are placed behind fan trays), the screen will reflect the active installed components to configure.

![An icon depicting a white document with horizontal lines and a folded top-left corner, overlaid with a large red checkmark.](.atca-system-manager-50-1g008-1000-200/62b28e7de5bca3ffa25050398c342efb024c47f628b03f4e7c9afd8faa709a2a.jpg)
NOTE:

The temperature threshold values are in degrees Celsius and their range is $-128^{\circ}C$ to $+127^{\circ}C$

# 3.6.3 Fan Tray Information

Installed fan trays are displayed in the UI and can be accessed in the same way as for ATCA boards and ShMC modules. The UI divides fan tray information into three areas from top to bottom: temperature level, M status, and fan number (with fan speed).

![The diagram displays two columns of green status blocks with connecting arrows labeled by central text.\n\n**Labeled Blocks:**\n\n**Left Column (top to bottom):**\n*   Ext2: 28 °c\n*   M4\n*   Fan1: 3684.6 rpm\n*   Fan2: 3766.48 rpm\n\n**Right Column (top to bottom):**\n*   Ext1: 33 °c\n*   M4\n*   Fan1: 3531.07 rpm\n*   Fan2: 3323.36 rpm\n*   Fan3: 3081.66 rpm\n*   Fan4: 3389.83 rpm\n*   Fan5: 3389.83 rpm\n*   Fan6: 3389.83 rpm\n\n**Connections:**\n*   **Temp:** Points to 'Ext2: 28 °c' and 'Ext1: 33 °c'.\n*   **M Status:** Points to 'M4' (in the left column) and 'M4' (in the right column).\n*   **Fan ID:** Points to 'Fan1: 3684.6 rpm' and 'Fan1: 3531.07 rpm'.\n*   **Fan Speed:** Points to 'Fan1: 3684.6 rpm' and 'Fan1: 3531.07 rpm'.](.atca-system-manager-50-1g008-1000-200/d3ab5092f23c55d549ea8cab2b6c04263924441206e274bf3dabba94264010ab.jpg)

# 3.6.4 Fan Tray Settings

Move the cursor to the desired fan tray and click to open the Fan Tray Settings window.

![Ext1:\n33 °C\nM4\nFan1:\n3531.07 rpm\nFan2:\n3323.36 rpm\nFan3:\n3081.66 rpm\nFan4:\n3389.83 rpm\nFan5:\n3389.83 rpm\nFan6:\n3389.83 rpm](.atca-system-manager-50-1g008-1000-200/0972187b20755d4f928cd9d2e07b80f6e569a073cbaaafaf09fefebe3730518d.jpg)

![ADLINK\nTECHNOLOGY INC.\nSet FanTray Fan Level\nSet Fan Level 8\nSubmit Reset\n(X) Close Window](.atca-system-manager-50-1g008-1000-200/8632f903acd86cc52c797e5f64656c6d6ec121b5ee2d0743bba578703d74ebe9.jpg)

Figure 3-9: Fan Tray Level Settings Screen
![The image displays a white document icon with a folded top-left corner. Faint gray horizontal lines run across the lower portion of the page, resembling text. A large, bold red checkmark is superimposed over the center of the document. The entire graphic is enclosed within a thin black square border.](.atca-system-manager-50-1g008-1000-200/f9ccc7d1b1604fa65a8832a0b84e11f8f8b638690f6c7ac9a77996e79c1912d3.jpg)
NOTE:

The fan levels are in hexadecimal and their range is 0 to F.

# 3.7 Platform Event Filtering (PEF)

The Platform Event Filtering function is a collection of IPMI interfaces that define how an IPMI Event can be compared against 'filter table' entries that, when matched, trigger a selectable action such as a system reset, power off, alert, etc. SNMP Trap alerts are also configured through PEF settings.

![The image displays a white document icon with a folded top-left corner. Horizontal grey lines run across the page. A large, red checkmark is superimposed over the document, extending from the bottom left to the top right.](.atca-system-manager-50-1g008-1000-200/e6551eff25934f0d91296bd5c28901f585357bec95cc4753ed3f882ca88df9f4.jpg)
NOTE:

PEF settings are critical to the operation of an ATCA chassis.

Please refer to the IPMI Spec. 1.5 Rev. 1.1 for details.

# 3.7.1 Setting PEF with System Manager

The user interface allows direct access to PEF settings from the quick links bar at the top of the screen.

![A red logo featuring a stylized letter 'A' shaped like a triangle, with three horizontal white stripes inside.](.atca-system-manager-50-1g008-1000-200/4fb9cbc37d307ae5fa34ac4f5b1536128def7a9149835dda765f42cc1f2f7de3.jpg)

ADLINK

TECHNOLOGY INC.

About

Definitions

PEF Settings

Logout

Clicking the &lt;PEF Settings&gt; link opens a new window for configuring PEF settings.

Platform Event Filter Settings
![The image displays a narrow, vertical section of a software interface. On the far left, there is a light blue vertical rectangle containing a white downward-pointing chevron (arrow). To the right of this blue area, the word 'Write' is visible, oriented vertically with letters stacked from top to bottom. Below 'Write', the text 'SNMP Action' is visible, also oriented vertically with letters stacked from top to bottom. The text is black against a white background.](.atca-system-manager-50-1g008-1000-200/2834ebf270a780fd6e2dce7db2d11476a9043b8664d926839233110c08c23ca2.jpg)

<table><tr><td>LAN Configuration Destination Type</td><td>Selector 1</td><td>Type 00</td><td>Time out 00</td><td>Retries 00</td></tr><tr><td>LAN Configuration Destination Address</td><td>Selector 1</td><td>Gateway SEL 0</td><td>Alert IP</td><td>172.16.13.101</td></tr></table>

PEF Configuration Event Filter Data

<table><tr><td></td><td>01</td><td>80</td><td>01</td><td>01</td><td>02</td><td>ff</td><td>ff</td><td>f0</td><td>ff</td><td>ff</td><td>ff</td><td>ff</td><td>00</td><td>00</td><td>00</td><td>00</td><td>00</td><td>00</td><td>00</td><td>00</td></tr><tr><td colspan="4">☑ PEF Configuration Action Alert Policy Data</td><td>Entry Number</td><td>01</td><td>Policy Number</td><td>1</td><td colspan="2">Policy 8</td><td colspan="2">Channel 1</td><td colspan="2">Selector 1</td><td></td><td></td><td></td><td></td><td></td><td></td><td></td></tr></table>

![The image displays a snippet of a table with grid lines. On the left, there are two green checked boxes. Next to the top box is the text 'PEF Configuration'. Next to the bottom box is the text 'Action Global Control'. In the column to the far right, centered vertically, is the text '1f'.](.atca-system-manager-50-1g008-1000-200/fde5b21afd898e8a3284527424fdad46f24f033285efba8d90fddaf9936b57be.jpg)

![The image displays a cropped row from a digital interface, likely a settings menu or table. It is divided into columns:\n- The left column features a checked checkbox (indicated by a green checkmark) next to the text '**PEF Configuration**'.\n- The middle column contains the text '**Control**'.\n- The rightmost column displays the number '**1**'.](.atca-system-manager-50-1g008-1000-200/0bb1218086b01286bf9b1091e8240c27cb47b6a9b31e053f7bb922d07ce7022b.jpg)

![The image displays a horizontal row of twelve square checkboxes with vertical black borders. To the right of each checkbox is a text label in black, sans-serif font. The labels alternate between 'Reset' and 'Submit'.\n\nThe text reads verbatim from left to right:\nReset, Submit, Reset, Submit, Reset, Submit, Reset, Submit, Reset, Submit, Reset, Submit](.atca-system-manager-50-1g008-1000-200/62ff2256f99e358e6523485e6f415d81fc474f3fe92db63f740cd0cf0d4f5fb0.jpg)

![The image displays a simple graphic consisting of five vertical black bars separated by white space on a white background.](.atca-system-manager-50-1g008-1000-200/923c67e220b06180e396d664f970153e61c5c60935325529b328f0a1d7bc30ac.jpg)
IPMI Spec. V1.5 Revision 1.1 Table15-2
Figure 3-10: PEF Settings Screen

# Use the following settings for SNMP Trap configurations.

Non-critical Event Temperature Sensor Settings:
PEF Configuration Event Filter Data

<table><tr><td>02</td><td>80</td><td>11</td><td>01</td><td>08</td><td>ff</td><td>ff</td><td>01</td><td>ff</td><td>ff</td><td>ff</td><td>ff</td><td>00</td><td>00</td><td>00</td><td>00</td><td>00</td><td>00</td><td>00</td><td>00</td><td>00</td></tr></table>

Critical Event Temperature Sensor Settings:
PEF Configuration Event Filter Data

<table><tr><td>03</td><td>80</td><td>11</td><td>01</td><td>10</td><td>ff</td><td>ff</td><td>01|</td><td>ff</td><td>ff</td><td>ff</td><td>ff</td><td>00</td><td>00</td><td>00</td><td>00</td><td>00</td><td>00</td><td>00</td><td>00</td><td>00</td></tr></table>

Non-recoverable Event Temperature Sensor Settings:
PEF Configuration Event Filter Data

<table><tr><td>04</td><td>80</td><td>11</td><td>01</td><td>20</td><td>ff</td><td>ff</td><td>01</td><td>ff</td><td>ff</td><td>ff</td><td>ff</td><td>00</td><td>00</td><td>00</td><td>00</td><td>00</td><td>00</td><td>00</td><td>00</td></tr></table>

Non-critical Event Voltage Sensor Settings:
PEF Configuration Event Filter Data

<table><tr><td>05</td><td>80</td><td>11</td><td>01</td><td>08</td><td>ff</td><td>ff</td><td>02</td><td>ff</td><td>ff</td><td>ff</td><td>ff</td><td>00</td><td>00</td><td>00</td><td>00</td><td>00</td><td>00</td><td>00</td><td>00</td></tr></table>

Critical Event Voltage Sensor Settings:
PEF Configuration Event Filter Data

<table><tr><td>06</td><td>80</td><td>11</td><td>01</td><td>10</td><td>ff</td><td>ff</td><td>02</td><td>ff</td><td>ff</td><td>ff</td><td>ff</td><td>00</td><td>00</td><td>00</td><td>00</td><td>00</td><td>00</td><td>00</td><td>00</td><td>00</td></tr></table>

Non-recoverable Event Voltage Sensor Settings:
PEF Configuration Event Filter Data

<table><tr><td>07</td><td>80</td><td>11</td><td>01</td><td>20</td><td>ff</td><td>ff</td><td>02</td><td>ff</td><td>ff</td><td>ff</td><td>ff</td><td>00</td><td>00</td><td>00</td><td>00</td><td>00</td><td>00</td><td>00</td><td>00</td><td>00</td></tr></table>

# 3.7.2 Setting PEF with Shelf Manager Command Line

PEF settings can also be configured through the shelf manager command line. The ADLINK factory PEF settings are stored in / bin/adlink\_ pef. If you wish to restore the ADLINK PEF default settings, login to the shelf manager console and run the script below:

```txt
#clear_event_filter
#destination_ip $IP(Alert IP as same as system manager IP)
#adlink_pef
```

# 3.7.3 Monitoring SNMP Trap Alerts

In order to monitor SNMP trap, users need to confirm the platform event trap format. The system manager recognizes format 0 only. The shelf manager default format is 0. To determine the current format, please enter the following command:

```txt
# clia getpefconfig pet_format
Pigeon Point Shelf Manager Command Line Interpreter
Platform Event Trap format: 0 (IPMI default)
#
```

If your current format is not 0, please configure the format to 0, otherwise the SNMP Trap Alerts function of the system manager will be disabled. To set the platform event trap format to 0, please enter the following command:

```txt
# clia setpefconfig pet_format 0
Pigeon Point Shelf Manager Command Line Interpreter
Platform Event Trap format set successfully
#
```

If properly configured, the System Manager will monitor and display all chassis information and board sensors. In order to do so, the System Manager must communicate properly with the snmp trap via IP.

To check the snmptc process, login to the system manager server command line and type:

#ps -ef | grep snmptc

![(root@localhost ~)# ps -ef | grep snmptc\nroot 1987 1 0 14:19 ?\nroot 2366 2350 0 14:47 pts/1 00:00:00 grep snmptc\n(root@localhost ~)#](.atca-system-manager-50-1g008-1000-200/b0eb5c7d750c8d8bb7dacd3af96e7f2a577dabb51ef5182bd280e9bf9414b868.jpg)

If the system returns &lt; 00:00:00 snmptc &gt; your system is functioning normally. If not, you must check your host IP address.

The host computer IP address acts as the access point for the graphical user interface. The snmptc cannot auto-run unless the host PC has an IP address. To confirm the host computer's IP address, from the Linux command line under root type:

#ifconfig

Please record the resulting IP address for reference.

Once you have an IP address, manually start the &lt;snmptcd&gt; at the command line by typing:

#snmptcd start

<table><tr><td>File Edit View Terminal Tabs Help</td></tr><tr><td>[root@localhost ~]# ps -ef | grep snmptc root 2376 2350 0 14:48 pts/1 00:00:00 grep snmptc [root@localhost ~]# snmptcd start Starting snmptc ....... [root@localhost ~]# ps -ef | grep snmptc root 2388 1 0 14:49 ? 00:00:00 snmptc root 2392 2350 0 14:49 pts/1 00:00:00 grep snmptc [root@localhost ~]#</td></tr></table>

To confirm your settings type:

/etc/rc.local

Once the snmptc daemon is running properly, the System Manager can display SNMP Trap alerts for hotswap, temperature and voltage sensors. The following is an example of open handle alarms where Slot 2 and Slot 4 have surpassed their threshold setting for M status and the shelf manager has sent SNMP trap alerts to the System Manager.

![Left Temp: 26 °C\nPEM_A. Power On\nPEM_B. Power On\nRight Temp: 34 °C\nAdvanced TCA*\nExt2:\n26 °C\nShMC2\nM4\nLeft CMM: 26 °C\nActive\nShMC1\nM4\nRight CMM: 23 °C\nStandby\nM4\nFan1:\n2922.27 rpm\nSlot 5\nShMC2\nShMC1\nFan1:\n1994.02 rpm\nFan2:\n1904.4 rpm\nFan3:\n1803.1 rpm\nFan4:\n1948.18 rpm\nFan2:\n2973.54 rpm\nSlot 4\nM1\nSystemTemp 21 °C\nCPU_0Temp 28 °C\nSlot 3\nSlot 2\nM6\nLM75BoardTemp 25 °C\n+1.8V 1.81 V\nSlot 1](.atca-system-manager-50-1g008-1000-200/025d8eb143eb5aaccfbe3f7af1421aedd7bfd1cb183104b905a4c68491d50f47.jpg)

# 4 Getting Started - aTCA-8214

This chapter introduces how to start up and log into the ADLINK aTCA System Manager, the graphical user interface, and its functions. This chapter describes using the ADLINK aTCA-8214 chassis as the target system.

# 4.1 System Manager Startup

The ADLINK aTCA System Manager is designed to automatically run on the host computer when it boots. This process includes starting the web server and the Simple Network Management Protocol Trap Catcher (snmptc) daemon.

Your client computer should have a copy of Microsoft Internet Explorer 5 or Mozilla Firefox 1 installed and a monitor that supports 1024 x 768 resolution for optimal viewing.

![The image shows a document icon featuring a large red checkmark. Below the icon is the text 'NOTE:' in black capital letters.](.atca-system-manager-50-1g008-1000-200/0a918b6f8c3d67ba73280847d9677378e82471d80d571533cd6db176e957d644.jpg)

The System Manager UI is optimized for viewing with Microsoft Windows based Internet Explorer 5 and Mozilla Firefox 1, and Red Hat Linux 9.0 and Fedora Core 5 based Mozilla Firefox 1. Non-supported Linux distributions and/or browsers may cause scripting bugs and are not recommended for use.

If you receive any error messages and your system does not startup normally, your snmptc daemon may not have registered the host IP. Please see Section 4.7.3 for further instructions or Chapter 5 for troubleshooting information.

# 4.2 Login

After system startup, load your client browser to access the System Manager. You should have your host computer IP address ready. At the address bar of the browser type:

```txt
http://[Host_PC_IP_Address]/system_manager/ex. http://172.16.13.106/system_manager/
```

![Mozilla Firefox\nFile Edit View Go Bookmarks Tools Help\nhttp://172.16.13.106/system_manager/\nLatest Release Notes Fedora Project Fedora Weekly News Community Support](.atca-system-manager-50-1g008-1000-200/f734490a5458d337225b94547e4dd14a0ae2b06ac9233663e6a4dd5687d9e53b.jpg)

![The image features a white document icon with a folded top-right corner and faint horizontal lines representing text. A large red checkmark is superimposed on the left side of the document.](.atca-system-manager-50-1g008-1000-200/91864652b9c08240db32cdac99ac2309f184731b01372e5a7dbc4e3c5e3c65b5.jpg)
NOTE:

You must allow pop-up windows in your browser settings to fully access the System Manager UI.

The System Manager will open a new window and run the System Manager User Interface Login Screen:
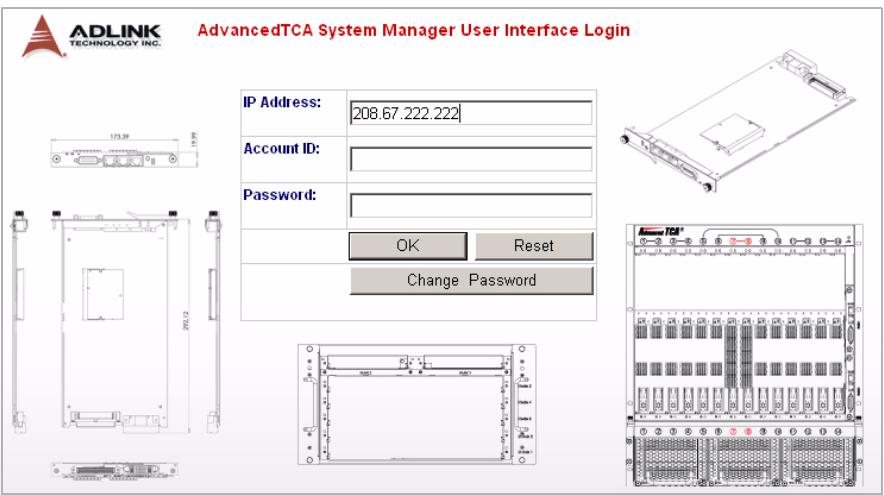
![AdvancedTCA System Manager User Interface Login\nIP Address: 208.67.222.222\nAccount ID:\nPassword:\nOK Reset\nChange Password](.atca-system-manager-50-1g008-1000-200/1e6881747f8e512fc4a8b5c68fffb73293121c3ffc1245691495c3703b08aadb.jpg)

Figure 4-1: Login Screen

Login with the following default account information:

IP address: [ATCA\_CMM\_IP\_Address]

Account ID: admin

Password: adminq

The system administrator may change the password settings from the user interface login screen by clicking &lt; Change Password&gt;.

After a successful login the System Manager will automatically detect your chassis type and open the Default Sensor Settings Screen.

# 4.2.1 Default Sensor Settings Screen

The Default Sensor Settings Screen is the initial configuration screen for your chassis and installed ATCA boards. If you have multiple chassis set up for your System Manager, the Default Sensor Settings Screen will configure and save your settings for all chassis and installed ATCA boards.

The Sensor Settings screen allows users to define which slots to monitor. Each slot allows for one hot swap sensor

For detailed instructions on configuring board sensors, refer to Section 4.4.3.

![The image displays a logo featuring a large, rust-red shape resembling an upward-pointing triangle or the letter 'A'. Inside the upper portion are three horizontal white stripes, and a curved white line arcs along the bottom. A small letter 'A' is situated in the bottom right corner.](.atca-system-manager-50-1g008-1000-200/1b329ab230074cc66ab07b61617b490785b1dad2af39b5687b6894c5608c10bc.jpg)

ADLINK TECHNOLOGY INC.

ADLINK-8214 Sensor Settings
![Advanced TCA®\n①—② ③—④ ⑤ ⑥ ⑦—⑧ ⑨ ⑩ ⑪—⑫ ⑬—⑭\nHS01 HS02 HS03 HS04 HS05 HS06 HS07 HS08 HS09 HS10 HS11 HS12 HS13 HS14\n0 0 0 0 0 0 0 0 0 0 0 0 0 0\nSubmit Reset Cancel\nShMC1\nShMC2](.atca-system-manager-50-1g008-1000-200/ce6e30b79f91d93648a581b6d5d47b26dfe601358b7683f36c35b834362092dd.jpg)

Figure 4-2: Default Sensor Settings Screen

If this is your first time running the System Manager, leave the settings unchanged and just click &lt;Submit&gt; to proceed to the System Manager main screen. Or enter your preferred settings and click &lt;Submit&gt;. Click &lt;Reset&gt; to discard changes or click &lt;Cancel&gt; to return to the login screen.

# 4.2.2 System Manager Main Screen

Depending on the number and type of ATCA boards and CMMs installed in your chassis, the resulting display should resemble the following:

![The image displays a logo featuring a stylized, reddish-brown capital letter 'A'. Inside the upper portion of the letter, there are three horizontal white lines. The base of the shape has a slight upward curve.](.atca-system-manager-50-1g008-1000-200/d9f6da2e2c1bb1b5b3c53fcd8638bedab81fa8438da48d9f5ba6ea3457b27b58.jpg)

ADLINK

TECHNOLOGY INC.

About

(1) 2017年1月1日，公司发布《关于使用部分闲置募集资金进行现金管理的公告》（公告编号：2017-036）。

Definitions

(1) 本说明仅供参考。

PEF Settings

(1) 2017年1月1日至2018年1月1日（含）的公司股票交易均价为4.56元/股，与前一交易日收盘价相比，涨幅为-0.97%。

Logout

![Advanced TCA®\n①—② ③—④ ⑤ ⑥ ⑦—⑧ ⑨ ⑩ ⑪—⑫ ⑬—⑭\nM4 M4 M4 M4 M4 M4 M4 M4 M4 M4 M4\nTGF TGF TGF TGF TGF TGF TGF TGF TGF TGF TGF TGF TGF\nM4\nB1: 3348 RPM\nB2: 3330 RPM\nS1: 5885 RPM\nS2: 6298 RPM\nTemp: 29 °C\nM4\nB1: 3816 RPM\nB2: 3798 RPM\nS1: 6298 RPM\nS2: 6573 RPM\nTemp: 27 °C\nM4\nB1: 3798 RPM\nB2: 3798 RPM\nS1: 6435 RPM\nS2: 6435 RPM\nTemp:26 °C\nShMC1\nShMC2](.atca-system-manager-50-1g008-1000-200/0f30d3fdb6a6c1361511f67f9c29546033dc9a275e188752dc1b2550892892d4.jpg)

Product Name: 14-SlotATCAChassis

Part Number: ATCA8214

Serial Number: 0000000006

Version: DualStar

IP: 172.16.13.209

Telco Alarms: Normal, No Alarm

IPMB-Link: IPM-A enabled, IPM-B enabled

EEPROM 1: Active

EEPROM 2: Active

External Temp1: 21 °C

External Temp2: 21 °C

External Temp3: 21 °C

External Temp4: 22°C

Sensor Number Setting

Clear Telco Alarm

Clear All Alert

<table><tr><td rowspan="2">PEM_A</td><td>Breaker 0</td><td>ON</td><td>Voltage</td><td>48 V</td></tr><tr><td>Breaker 1</td><td>ON</td><td>Voltage</td><td>48 V</td></tr></table>

<table><tr><td rowspan="2">PEM_B</td><td>Breaker 0</td><td>ON</td><td>Voltage</td><td>48 V</td></tr><tr><td>Breaker 1</td><td>ON</td><td>Voltage</td><td>48 V</td></tr></table>

Figure 4-3: System Manager Main Screen

# 4.3 Navigating the User Interface

The ADLINK aTCA System Manager User Interface (UI) is designed to be user friendly and visually descriptive. All areas of the user interface directly resemble their location and function in relation to the actual chassis as well as monitoring and configuration data in real time. The user interface has three major sections:

Header Section: Presents quick links, chassis hardware information, including product name, part number, serial number, version, IP address, and the chassis reference image.

![The image displays a large, reddish-brown triangle pointing upwards against a white background. Inside the triangle are five white, curved horizontal lines stacked vertically. A thin black line runs along the top edge of the image.](.atca-system-manager-50-1g008-1000-200/63d1b40a3cb9eaa2a7a2570148303922e31cd0cf77f5c941c6b6ff3509ce111a.jpg)

ADLINK TECHNOLOGY INC.

About | Definitions | PEF Settings | Logout |
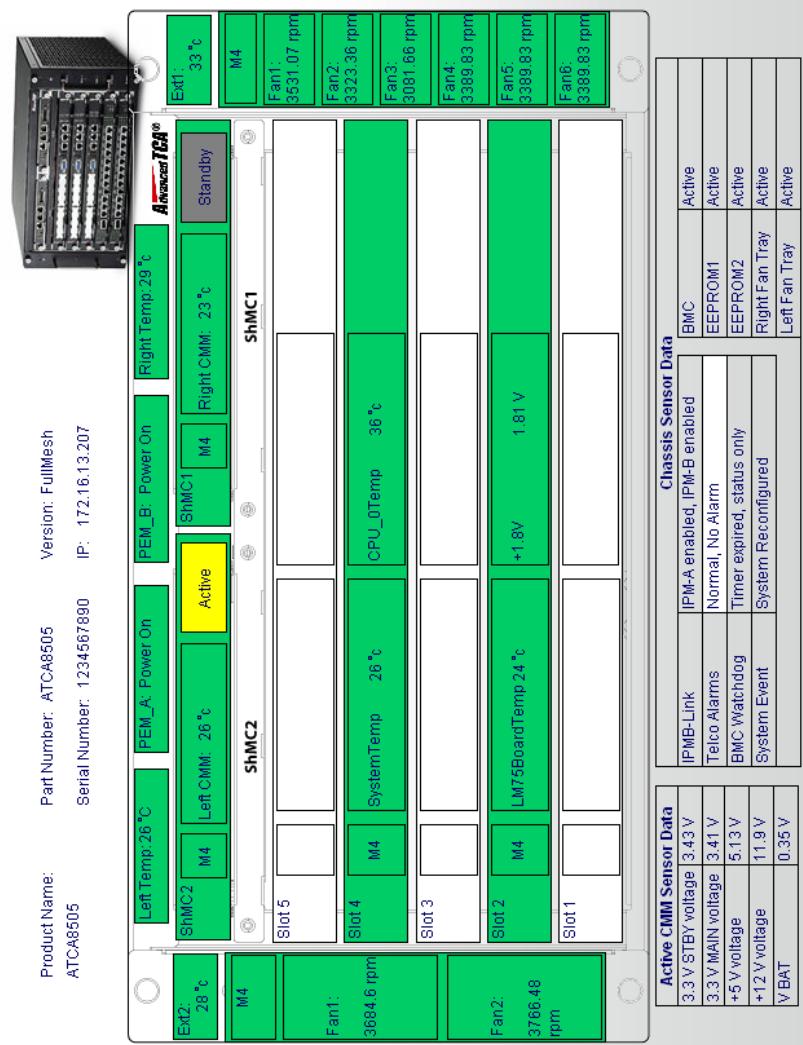
Body Section: Direct access for monitoring and control of all temperature settings, M status, board health and fan tray activity, CMM's and ATCA boards. See Figure 4-4 for the Definitions & Color Codes Screen on page 70.

![Advanced TCA®\n①—② ③—④ ⑤ ⑥ ⑦—⑧ ⑨ ⑩ ⑪—⑫ ⑬—⑭ ⑮\nM4 M4 M4 M4 M4 M4 M4 M4 M4 M4 M4 M4\nM4\nM4\nM4\nM4\nM4\nM4\nM4\nM4\nM4\nM4\nM4\nM4\nM4\nM4\nM4\nM4\nM4\nM4\nM4\nM4\nM4\nM4\nM4\nM4\nM4\nM4\nM4\nM4\nM4\nM4\nM4\nM4\nM4\nM3\nB1: 3348 RPM\nB2: 3330 RPM\nS1: 5885 RPM\nS2: 6298 RPM\nTemp: 29 °C\nM4\nB1: 3816 RPM\nB2: 3798 RPM\nS1: 6298 RPM\nS2: 6573 RPM\nTemp: 27 °C\nM4\nB1: 3798 RPM\nB2: 3798 RPM\nS1: 6435 RPM\nS2: 6435 RPM\nTemp:26 °C](.atca-system-manager-50-1g008-1000-200/166bd4bd9dfa32984731d1779e55ea59b28eb5016b42f8dd50ba1219293d91e2.jpg)

<table><tr><td rowspan="2">PEM_A</td><td>Breaker 0</td><td>ON</td><td>Voltage</td><td>48 V</td></tr><tr><td>Breaker 1</td><td>ON</td><td>Voltage</td><td>48 V</td></tr></table>

The user interface also offers "One Click Access" allowing direct access to any CMM, ATCA or Fan Tray with the single click of a mouse.

![The image displays a low-resolution, pixelated icon of a computer cursor. It depicts a stylized hand with the index finger pointing upward.](.atca-system-manager-50-1g008-1000-200/fa79769d4936f30568a91ab5028c5a93495870b6de847c45d6204246d6974acb.jpg)

# Side Section: Displays Telco Alarm, Backplane Temperature Sensor, and other important chassis information.

Product Name: 14-SlotATCAChassis

Part Number: ATCA8214

Serial Number: 0000000006

Version: DualStar

IP: 172.16.13.209

Telco Alarms: Normal, No Alarm

IPMB-Link: IPM-A enabled, IPM-B enabled

EEPROM 1: Active

EEPROM 2: Active

External Temp1: 21 °C

External Temp2: 21 °C

External Temp3: 21 °C

External Temp4: 22°C

Sensor Number Setting

Clear Telco Alarm

Clear All Alert

# 4.3.1 Quick Links

![The image displays a logo consisting of a reddish-brown, upward-pointing triangular shape that resembles a stylized letter 'A'. Inside the upper portion of the shape are three horizontal white stripes. The background is white. There is no text visible in the image.](.atca-system-manager-50-1g008-1000-200/e9ba1b8467b7f30f842b5564a50a593640a11187cb2903c3710a49f502aa41d6.jpg)

ADLINK TECHNOLOGY INC.

About

Definitions

PEF Settings

Logout

Click any of the quick links to view their associated information:

About: A brief overview of the System Manager

Definitions: Hardware and software sensor codes, alarms and settings (see Figure 4-4 Definitions & Color Codes Screen on page 70 for details).

PEF Settings: Hardware and software configuration/settings (see Section 4.7.1 for details).

Logout: System Logout (automatically returns users to the login screen).

![The image displays a yellow triangular warning sign with a black border. Centered inside the triangle is a black exclamation point. Below the triangle, the text 'CAUTION:' is printed in black capital letters.](.atca-system-manager-50-1g008-1000-200/3ca9f071029b6f48dd7a4fb30353439eb614f82463a07ed7c51a659ae00fa94e.jpg)

In order to avoid unauthorized access, remember to Logout when not actively configuring or monitoring the System Manager.

![The image displays a logo featuring a large, rust-colored shape resembling a stylized letter 'A' or a triangle. Inside the upper portion of the shape are three horizontal white stripes. The bottom of the shape curves upward like an arch, and the background is white.](.atca-system-manager-50-1g008-1000-200/45c67f8fa61ecf928f44adb8658772b9ff78f9f355627306130873ba070cc7ec.jpg)

ADLINK

TECHNOLOGY INC.

[x] Close Window

Sensor Alarm

<table><tr><td></td><td>Normal</td></tr><tr><td></td><td>Alarm</td></tr></table>

CMM Status

<table><tr><td></td><td>CMM Standby</td></tr><tr><td></td><td>CMM Active</td></tr></table>

Temperature / Voltage Sensor

<table><tr><td></td><td>Non-Critical Alert</td></tr><tr><td></td><td>Critical Alert</td></tr><tr><td></td><td>Non-Recoverable Alert</td></tr></table>

Hot Swap State

<table><tr><td></td><td>M4</td></tr><tr><td></td><td>Out of M4</td></tr><tr><td></td><td>Present and Inactive</td></tr></table>

Telco Alarms

<table><tr><td></td><td>Normal</td></tr><tr><td></td><td>Alarm</td></tr></table>

# aTCA Spec Definitions

# Hot Swap (Sensor Type Code: F0h)

Current State Mask

<table><tr><td>0x0001</td><td>FRU Not Installed</td></tr><tr><td>0x0002</td><td>FRU Inactive</td></tr><tr><td>0x0004</td><td>FRU Activation Request</td></tr><tr><td>0x0008</td><td>FRU Activation In Progress</td></tr><tr><td>0x0010</td><td>FRU Active</td></tr><tr><td>0x0020</td><td>FRU Deactivation Request</td></tr><tr><td>0x0040</td><td>FRU Deactivation In Progress</td></tr><tr><td>0x0080</td><td>Communication Lost</td></tr></table>

# IPMB LINK (Sensor Type Code: F1h)

Current State Mask

<table><tr><td>0x0001</td><td>IPM-A disabled, IPM-B disabled</td></tr><tr><td>0x0002</td><td>IPM-A enabled, IPM-B disabled</td></tr><tr><td>0x0004</td><td>IPM-A disabled, IPM-B enabled</td></tr><tr><td>0x0008</td><td>IPM-A enabled, IPM-B enabled</td></tr></table>

# IPMI Specification Definitions

BMC Watchdog (Sensor Type Code: 23h)

<table><tr><td>0x0000</td><td>Timer expired, status only</td></tr><tr><td>0x0001</td><td>Hard reset</td></tr><tr><td>0x0002</td><td>Power down</td></tr><tr><td>0x0003</td><td>Power cycle</td></tr><tr><td>0x0008</td><td>Timer interrupt</td></tr></table>

System Event (Sensor Type Code: 12h)

<table><tr><td>0x0000</td><td>System reconfigured</td></tr><tr><td>0x0001</td><td>OEM system boot event</td></tr><tr><td>0x0002</td><td>Undetermined system hardware failure</td></tr><tr><td>0x0003</td><td>Entry added to auxiliary log</td></tr><tr><td>0x0004</td><td>PEF action</td></tr></table>

# ADLINK OEM Definitions

OEM Reserved (Sensor Type Code: C0h-FFh)

<table><tr><td></td><td>0x0001</td><td>0x0002</td></tr><tr><td>HW Monitor SMI</td><td>Normal</td><td>Abnormal</td></tr><tr><td>HW Mon Over Temp</td><td>Normal</td><td>Abnormal</td></tr><tr><td>HW Mon WD T/out</td><td>Normal</td><td>Abnormal</td></tr><tr><td>ICH WD Timeout</td><td>Normal</td><td>Abnormal</td></tr><tr><td>CPU FERR</td><td>Normal</td><td>Abnormal</td></tr><tr><td>CPU IERR</td><td>Normal</td><td>Abnormal</td></tr><tr><td>MCH/PXH Over Temp</td><td>Normal</td><td>Abnormal</td></tr><tr><td>S5 Sleep</td><td>Normal</td><td>Abnormal</td></tr><tr><td>Payload Power OK</td><td>Abnormal</td><td>Normal</td></tr><tr><td>BIOS POST OK</td><td>Abnormal</td><td>Normal</td></tr></table>

Figure 4-4: Definitions & Color Codes Screen
![The image displays a white document icon featuring a folded top-left corner and horizontal black lines representing text. A large, bold red checkmark is superimposed over the center of the document.](.atca-system-manager-50-1g008-1000-200/d80fd4de04a44f51a37c477528836c1dd1e9e01b7273c3890eb973ab127979e3.jpg)
NOTE:

Please take special notice of the color codes. For example, M status color determines if a board or module is present, active, etc. These color codes allow for simple monitoring and understanding of the health and activity of your chassis.

# 4.4 ATCA Boards

There are fourteen slots on the user interface corresponding to the fourteen slots on the shelf that can be mounted with an ATCA board. The UI divides the board information into two areas from top to bottom: M status and Sensor Alert Status.

![M4\nM Status\nSensor Alert Status](.atca-system-manager-50-1g008-1000-200/30fccb0c58126224e6e583f0ebb65c5ee59cffe4fa662ef8c2026f8633263f88.jpg)

# 4.4.1 Getting ATCA Board Information

Move your cursor to any installed ATCA board. Click any area under the Sensor Alert Status area.

The System Manager will open a new window and display all available sensor information for the selected board.

![The image displays a stylized, rust-colored triangular logo centered on a white background. The shape resembles a capital letter 'A' with a curved bottom edge. Inside the red shape, there are three horizontal white stripes or cutouts running across the upper section.](.atca-system-manager-50-1g008-1000-200/b00d0c79f4de76ba61f9838b58340fc55ceb3342ea1d1a1539aa8ba967dff123.jpg)

ADLINK

TECHNOLOGY INC.

[x] Close Window

# MANUFACTURER:

Part Number:

Serial Number:

Version:

CMM IP: 172.16.13.208

Slot Number: 9

Temperature

<table><tr><td>Check</td><td>No.</td><td>ID</td><td>Value</td></tr><tr><td></td><td>3</td><td>SystemTemp</td><td>35°C</td></tr><tr><td></td><td>4</td><td>CPU_0Temp</td><td>48°C</td></tr><tr><td></td><td>5</td><td>CPU_1Temp</td><td>48°C</td></tr></table>

Voltage

<table><tr><td>Check No.</td><td>ID</td><td>Value</td></tr><tr><td>6</td><td>+3.3V</td><td>3.39 V</td></tr><tr><td>7</td><td>+1.8V</td><td>1.78 V</td></tr><tr><td>8</td><td>+1.5V</td><td>1.5 V</td></tr><tr><td>9</td><td>+5.0V</td><td>5.15 V</td></tr></table>

Other

<table><tr><td colspan="3">Check No ID Value</td></tr><tr><td></td><td>0</td><td>HotSwap 0x0010</td></tr><tr><td></td><td>1</td><td>IPMBPhysical 0x0008</td></tr><tr><td></td><td>2</td><td>BMCWatchdog 0x0000</td></tr><tr><td></td><td>10</td><td>HWMonitorSMI 0x0001</td></tr><tr><td></td><td>11</td><td>HWMonOverTemp 0x0001</td></tr><tr><td></td><td>12</td><td>HWMonWDT/out 0x0001</td></tr><tr><td></td><td>13</td><td>ICHWDTimeout 0x0001</td></tr><tr><td></td><td>14</td><td>CPUFERR 0x0001</td></tr><tr><td></td><td>15</td><td>CPUIERR 0x0001</td></tr><tr><td></td><td>16</td><td>MCH/PXHOverTemp 0x0001</td></tr><tr><td></td><td>17</td><td>S5Sleep 0x0001</td></tr><tr><td></td><td>18</td><td>PayloadPowerOK 0x0002</td></tr><tr><td></td><td>19</td><td>BIOSPOSTOK 0x0002</td></tr></table>

Use this reference number set the Hot Swap Sensor Number in Section 4.2.1 and Section 4.4.3.

# 4.4.2 ATCA Board Settings

At the bottom of the board information window, there are four options allowing users to configure sensor threshold, reset the board, turn board power off, and turn board power on.

![Sensor Threshold\nBoard Reset\nBoard Power Off\nBoard Power On](.atca-system-manager-50-1g008-1000-200/89d2ab6c585c806d900900f95f2af0f739e381fdb72c2967fefcfef4dc96d028.jpg)

Clicking the &lt; Sensor Threshold &gt; button will open a new window for threshold settings as follows:

![MANUFACTURER: ADLINKTechnology\nPart Number: ATCA-6890\nSerial Number: 0000000000\nVersion: 0B3-008\nIP Address: 172.16.13.207\nSlot Number: 5\n\nTemperature Critical Threshold\nCheck Sensor ID Lower Upper Set Lower Set Upper\nSystemTemp 0 °C 75 °C -128 °C 127 °C\nCPU_0Temp 0 °C 80 °C -128 °C 127 °C\nCPU_1Temp 0 °C 80 °C -128 °C 127 °C\nVoltage Critical Threshold\nCheck Sensor ID Lower Upper Set Lower Set Upper\n+3.3V 3.01 V 3.61 V 0 y 5.61 y\n+1.8V 1.61 V 2.01 V 0 y 3.29 y\n+1.5V 1.3 V 1.7 V 0 y 3.29 y\n+5.0V 4.62 V 5.4 V 0 y 8.01 y\nSubmit Select All/Unselect All](.atca-system-manager-50-1g008-1000-200/7f934be859796cf3ae3ed4bcaeb91cbf91252fbc36043d4a81c060c420f4e895.jpg)

Figure 4-5: ATCA Board Sensor Settings Screen

![The image displays an icon of a piece of lined paper, resembling a document or checklist, overlaid with a large, bold red checkmark.](.atca-system-manager-50-1g008-1000-200/31f3635599a84496b67f3b95a97370ed8becdd80857db2199aff5ef408c3b709.jpg)
NOTE:

The temperature threshold values are in degrees Celsius and their range is $-128^{\circ}C$ to $+127^{\circ}C$

![The image displays a line-art icon of a document page with a folded top-left corner and horizontal lines running across it. A large, bold red checkmark is superimposed diagonally over the center of the document.](.atca-system-manager-50-1g008-1000-200/ead635207f2340c7892aef55cd0c48d6d83b9aa0c435670a905bc1e59cf44f58.jpg)
NOTE:

All Sensor Threshold settings are temporary. When you restart/reset this board, the settings will be reset to the default settings. Only hardware providers can permanently set the sensor threshold.

Clicking the &lt; Board Reset &gt; button resets the board.

Clicking the &lt; Board Power Off &gt; button on an activated ATCA board will immediately deactivate it, and the slot color will change accordingly (see to Figure 4-4 Definitions & Color Codes Screen on page 70).

Clicking the &lt; Board Power On &gt; button on an inactive ATCA board will activate it.

![The image displays two vertical black panels side-by-side. The left panel is labeled 'Inactive' at the bottom and features a white circle at the top, a white hand-gesture icon, a solid blue square, a bell icon outline, and the 'Advanced TDS' logo near the bottom. The right panel is labeled 'Active' and features similar icons but with modifications: a green square containing the text 'M4' replaces the blue square, and a small green dot appears below the bell icon outline. Both panels have a white circle at the very bottom.](.atca-system-manager-50-1g008-1000-200/a6e3008a424de133427111a07feaa0a82d306f3c3f0fca042f8c919af2763cbf.jpg)

# 4.4.3 Configuring ATCA Board Sensors

Clicking the &lt; Sensor Number Setting &gt; button will open the Sensor Settings screen.

<table><tr><td>Product Name:</td><td>14-SlotATCAChassis</td></tr><tr><td>Part Number:</td><td>ATCA8214</td></tr><tr><td>Serial Number:</td><td>0000000006</td></tr><tr><td>Version:</td><td>DualStar</td></tr><tr><td>IP:</td><td>172.16.13.209</td></tr><tr><td>Telco Alarms:</td><td>Normal, No Alarm</td></tr><tr><td>IPMB-Link:</td><td>IPM-A enabled, IPM-B enabled</td></tr><tr><td>EEPROM 1:</td><td>Active</td></tr><tr><td>EEPROM 2:</td><td>Active</td></tr><tr><td>External Temp1:</td><td>21 °c</td></tr><tr><td>External Temp2:</td><td>21 °c</td></tr><tr><td>External Temp3:</td><td>21 °c</td></tr><tr><td>External Temp4:</td><td>22 °c</td></tr></table>

Sensor Number Setting

Clear Telco Alarm

Clear All Alert

![Advanced TCA®\n①—② ③—④ ⑤ ⑥ ⑦—⑧ ⑨ ⑩ ⑪—⑫ ⑬—⑭\nHS01 HS02 HS03 HS04 HS05 HS06 HS07 HS08 HS09 HS10 HS11 HS12 HS13 HS14\n0 0 0 0 0 0 0 0 0 0 0 0 0 0\nSubmit Reset Close\nSHMC1\nSHMC2](.atca-system-manager-50-1g008-1000-200/44427b75bb26c47ddceba063c909958118e2a3c442480093fcc8cd26d3194f11.jpg)

Figure 4-6: ATCA Board Sensor Configuration Screen

In order to monitor blade M status, users must configure the appropriate Hot Swap Sensor Number for each blade. Each slot allows for one hot swap sensor only. Please refer Section 4.4.1 above to display the sensor numbers and configure them here.

Enter your preferred settings (or leave the settings unchanged) and click &lt; Submit &gt; to return to the System Manager main screen. Click &lt; Reset &gt; to discard changes or click &lt; Close &gt; to return to the main screen.

# 4.5 Shelf Management Controller

The Shelf Management Controller (ShMC) modules on the user interface correspond to the Chassis Management Modules (CMM) installed in the chassis. They can be accessed in the same way as for ATCA boards. The UI divides the module information into two areas from top to bottom: Active/Standby status, Sensor Alert status.

![Active/Standby status\nSensor Alert status](.atca-system-manager-50-1g008-1000-200/8ffe34334fe72c80de1479cb0d20be0a0644c4bc130e95dcf4a62c4da129b91d.jpg)

# 4.5.1 Getting ShMC Module Information

Move your cursor to any installed ShMC module. Click any area under the Sensor Alert Status area. The System Manager will open a new window. It will post all sensor information of the ShMC module (see below).

![The image displays a logo or icon featuring a rust-red shape that resembles an upward-pointing triangle with a curved bottom edge. Inside the upper section, there are three horizontal white stripes running parallel to each other. The background is plain white.](.atca-system-manager-50-1g008-1000-200/1a7117cb1c50f3c24117724dd217bd6143c4bed36c43729a8c6982d5ff5e24e0.jpg)

ADLINK

TECHNOLOGY INC.

[x] Close Window

MANUFACTURER: PigeonPointSystems

Product Name: PigeonPointSystemsShelfManager

Serial Number: PPS0000000

Version: Rev1.00

IP Address: 172.16.13.209

# Temperature

LocalTemp 32 °C

# Voltage

Other

<table><tr><td>FRU0HOT_SWAP</td><td>0x0010</td></tr><tr><td>IPMBLINK</td><td>0x0008</td></tr><tr><td>CPLD</td><td>0x0002</td></tr><tr><td>RebootReason</td><td>0x0400</td></tr></table>

Sensor Threshold

Reset CMM

Activate CMM

# 4.5.2 ShMC Module Settings

At the bottom of the module information window, there are three options allowing users to configure sensor thresholds, reset the CMM, or activate the CMM.

Other

<table><tr><td>FRU0HOT_SWAP</td><td>0x0010</td></tr><tr><td>IPMBLINK</td><td>0x0008</td></tr><tr><td>CPLD</td><td>0x0002</td></tr><tr><td>RebootReason</td><td>0x0400</td></tr></table>

Sensor Threshold

Reset CMM

Activate CMM

Clicking the &lt; Sensor Threshold &gt; button will open a new window for threshold settings as follows:

![The image features a maroon, upward-pointing triangle. Inside the lower portion of the triangle are four horizontal white stripes. Beneath the triangle, a white curved shape is visible at the bottom edge of the frame.](.atca-system-manager-50-1g008-1000-200/8a36adce79e22dd7715ead15cc1ef17f0ecadf0f7786550c396dbc5c4c12fd63.jpg)

ADLINK

TECHNOLOGY INC.

[x] Close Window

Chassis Temperature Critical Threshold

<table><tr><td>Check</td><td>Sensor</td><td>Get Lower</td><td>Get Upper</td><td>Set Lower</td><td>Set Upper</td></tr><tr><td></td><td>LocalTemp</td><td>-128 °C</td><td>65 °C</td><td>-128 °C</td><td>127 °C</td></tr></table>

Submit

![The image displays a simple black-and-white line drawing of a window frame. It is a large rectangle divided into four smaller, equal-sized rectangular panes by a central vertical line and a central horizontal line. In the center of each of the four panes, there is a small, roughly circular shape drawn. There is no text visible in the image.](.atca-system-manager-50-1g008-1000-200/60b05e7258bfd5ac5e36a893f195c51c5829553e2d3780362dda9be475a8b961.jpg)

Select All/Unselect All

Figure 4-7: ShMC Module Sensor Settings Screen
![The image displays a simple icon of a white piece of paper with a large red checkmark drawn on it. The paper is depicted as a document with faint horizontal lines and a folded top-right corner.](.atca-system-manager-50-1g008-1000-200/a7161ad35402a718eadeb8ae642434cad92f3ccff5881d746f85e94bcb2f8c41.jpg)
NOTE:

The temperature threshold values are in degrees Celsius and their range is $-128^{\circ}C$ to $+127^{\circ}C$

![The image displays a graphical icon of a white document or piece of paper. Faint horizontal gray lines run across the paper, simulating text. Superimposed over the document is a large, bold, red checkmark that angles upwards from left to right.](.atca-system-manager-50-1g008-1000-200/f81327dba8cd609e195ec849140454ff5a61fbf722ff854de8afa2e03c9fe5f1.jpg)
NOTE:

All Sensor Threshold settings are temporary. When you reset a CMM, the settings will also be reset. Only hardware providers can permanently set the sensor threshold.

# 4.6 Chassis Information

Chassis information is displayed in the user interface for easy visual reference. Power entry module information is displayed below the chassis representation. Fan tray information and one click access to fan tray settings are at the bottom of the chassis representation. Other sensor data is displayed on the right side.

![The image displays a reddish-brown triangle pointing upwards. Inside the triangle are three horizontal white lines of varying lengths. Below the triangle is a curved white line.](.atca-system-manager-50-1g008-1000-200/c288f8ca1b739514bb4673885b404aaababb8f0fcf478ed8ffb2da840770d530.jpg)

ADLINK

TECHNOLOGY INC.

About

Definitions

PEF Settings

Logout

![AdvancedTCA®\n①—② ③—④ ⑤ ⑥ ⑦—⑧ ⑨ ⑩ ⑪—⑫ ⑬—⑭\nFan Tray\nM4\nB1: 3348 RPM\nB2: 3330 RPM\nS1: 5885 RPM\nS2: 6298 RPM\nTemp: 29 °C\nM4\nB1: 3816 RPM\nB2: 3798 RPM\nS1: 6298 RPM\nS2: 6573 RPM\nTemp: 27 °C\nM4\nB1: 3798 RPM\nB2: 3798 RPM\nS1: 6435 RPM\nS2: 6435 RPM\nTemp:26 °C](.atca-system-manager-50-1g008-1000-200/73946f0f61a5a345d9b507a7b4ecec6122556edadc4f16c545cc0a31204156a1.jpg)

<table><tr><td rowspan="2">PEM_A</td><td>Breaker 0</td><td>ON</td><td>Voltage</td><td>48 V</td></tr><tr><td>Breaker 1</td><td>ON</td><td>Voltage</td><td>48 V</td></tr></table>

Product Name: 14-SlotATCAChassis

Part Number: ATCA8214

Serial Number: 0000000006

Version: DualStar

IP: 172.16.13.209

Telco Alarms: Normal, No Alarm

IPMB-Link: IPM-A enabled, IPM-B enabled

EEPROM 1: Active

EEPROM 2: Active

External Temp1: 21 °C

External Temp2: 21 °C

External Temp3: 21 °C

External Temp4: 22 °C

# Chassis Temperature

Power Entry Module

# 4.6.1 Chassis Sensor Data

Chassis sensor data is displayed for easy visual reference. If there is a Telco Alarm activated, users can quickly identify it by its error color (see Figure 4-4 for definitions and color code details).

If either ShMC has a Telco Alarm activated, users can clear the alarm by clicking the &lt;Clear Telco Alarm&gt; button on the right side of the System Manager Main Screen.

Sensor Number Setting

Clear Telco Alarm

Clear All Alert

To clear multiple alarms or alerts for all boards, click the &lt;Clear All Alert&gt; button.

# 4.6.2 Fan Tray Information

Installed fan trays are displayed in the UI and can be accessed in the same way as for ATCA boards and ShMC modules. The UI divides fan tray information into three areas from top to bottom: M status, fan speed, and temperature.

# 4.6.3 Fan Tray Settings

Move the cursor to the desired fan tray and click to open the Fan Tray Settings window.

![ADLINK\nTECHNOLOGY INC.\nSet FanTray Fan Level\nSet Fan Level 8\nSubmit Reset\n(x) Close Window](.atca-system-manager-50-1g008-1000-200/33b93673f45b90bbeebb756a90797a900730eda8249469e0e2fb1ddfd31eb2da.jpg)

Figure 4-8: Fan Tray Level Settings Screen

![The image displays a white document icon with a folded top-right corner. Faint horizontal lines run across the page, and a large, bold red checkmark is overlaid diagonally across the center.](.atca-system-manager-50-1g008-1000-200/5976ebfb6396ac2feee997ba67a69940d46a07efa901b886e8d47d109c07971e.jpg)
NOTE:

The fan levels are in hexadecimal and their range is 0 to F.

# 4.7 Platform Event Filtering (PEF)

The Platform Event Filtering function is a collection of IPMI interfaces that define how an IPMI Event can be compared against 'filter table' entries that, when matched, trigger a selectable action such as a system reset, power off, alert, etc. SNMP Trap alerts are also configured through PEF settings.

![The image displays a low-resolution icon of a document. It features a white sheet of paper with a folded top-right corner and faint horizontal grey lines suggesting text. A large, bold red checkmark is superimposed over the document, slanting diagonally from the bottom left to the top right.](.atca-system-manager-50-1g008-1000-200/3f4f066caff69078c3d883895807fd1ccd391de4d44dfb56fd21f94fd1260903.jpg)
NOTE:

PEF settings are critical to the operation of an ATCA chassis.

Please refer to the IPMI Spec. 1.5 Rev. 1.1 for details.

# 4.7.1 Setting PEF with System Manager

The user interface allows direct access to PEF settings from the quick links bar at the top of the screen.

![The image displays a logo resembling a capital letter 'A' or a triangle in a reddish-brown color. Inside the shape, near the bottom, there are three horizontal white stripes. The background is white.](.atca-system-manager-50-1g008-1000-200/aa521f167990099d1ce661076576650cd0a4b6e3256d270aaf40846172b7410a.jpg)

ADLINK

TECHNOLOGY INC.

About

Definitions

PEF Settings

Logout

Clicking the &lt;PEF Settings&gt; link opens a new window for configuring PEF settings.

Platform Event Filter Settings
![The image displays a vertical section of a user interface. The text 'Write' appears at the top (right edge). Below it is a dropdown menu component. This component consists of a light blue box on the left containing a white right-pointing arrow (chevron), followed by the text 'SNMP Action'. The text is oriented vertically.](.atca-system-manager-50-1g008-1000-200/5acefd43dc825b68d162aa9cd4b00b251d403dcb57a4b4b3c4ff06800b027bbf.jpg)

<table><tr><td>LAN Configuration Destination Type</td><td>Selector 1</td><td>Type 00</td><td>Time out 00</td><td>Retries 00</td></tr><tr><td>LAN Configuration Destination Address</td><td>Selector 1</td><td>Gateway SEL 0</td><td>Alert IP</td><td>172.16.13.101</td></tr></table>

PEF Configuration Event Filter Data

<table><tr><td></td><td>01</td><td>80</td><td>01</td><td>01</td><td>02</td><td>ff</td><td>ff</td><td>f0</td><td>ff</td><td>ff</td><td>ff</td><td>ff</td><td>00</td><td>00</td><td>00</td><td>00</td><td>00</td><td>00</td><td>00</td><td>00</td></tr><tr><td colspan="4">☑ PEF Configuration Action Alert Policy Data</td><td>Entry Number</td><td>01</td><td>Policy Number</td><td>1</td><td colspan="2">Policy 8</td><td colspan="2">Channel 1</td><td colspan="2">Selector 1</td><td></td><td></td><td></td><td></td><td></td><td></td><td></td></tr></table>

![The image displays a list with two rows. The top row shows an empty checkbox followed by the text '1 f'. The bottom row shows a checkbox with a green checkmark followed by the text 'PEF Configuration Action Global Control'.](.atca-system-manager-50-1g008-1000-200/d57f5d4c8f15ef638b60b29064abea716f159ac3331b63deafc236a0e5ddf686.jpg)

![The image shows a vertical list or table section with two rows. On the left side of each row is a square checkbox. The top row has an unchecked, empty white box. The bottom row has a checked box with a green background and a white checkmark. To the right of the checkboxes, the text reads 'PEF Configuration Control' followed by the number '1' in both rows.](.atca-system-manager-50-1g008-1000-200/fc35df5c7fc3ebbed6e767d0829287d970352a53036bf9461cf9fa8b6c09cd9e.jpg)

![The image displays a horizontal row of eleven identical checkboxes. Each box is checked and contains the text 'Reset' (formatted with 'Re-' on the top line and 'set' on the bottom line).](.atca-system-manager-50-1g008-1000-200/82df200af5128a7ac179d4ec4a4745ad9999daac8155ffbf98892ec2a631d2ff.jpg)

![The image displays a series of five vertical black bars of varying widths arranged on a white background.](.atca-system-manager-50-1g008-1000-200/a86efce334b26f5f3a3d11f4c3a2f2c87982bd8f2859ce79c93a8a7dea8c5efb.jpg)
IPMI Spec. V1.5 Revision 1.1 Table15-2
Figure 4-9: PEF Settings Screen

# Use the following settings for SNMP Trap configurations.

Non-critical Event Temperature Sensor Settings:
PEF Configuration Event Filter Data

<table><tr><td>02</td><td>80</td><td>11</td><td>01</td><td>08</td><td>ff</td><td>ff</td><td>01</td><td>ff</td><td>ff</td><td>ff</td><td>ff</td><td>00</td><td>00</td><td>00</td><td>00</td><td>00</td><td>00</td><td>00</td><td>00</td><td>00</td></tr></table>

Critical Event Temperature Sensor Settings:
PEF Configuration Event Filter Data

<table><tr><td>03</td><td>80</td><td>11</td><td>01</td><td>10</td><td>ff</td><td>ff</td><td>01|</td><td>ff</td><td>ff</td><td>ff</td><td>ff</td><td>00</td><td>00</td><td>00</td><td>00</td><td>00</td><td>00</td><td>00</td><td>00</td><td>00</td></tr></table>

Non-recoverable Event Temperature Sensor Settings:
PEF Configuration Event Filter Data

<table><tr><td>04</td><td>80</td><td>11</td><td>01</td><td>20</td><td>ff</td><td>ff</td><td>01</td><td>ff</td><td>ff</td><td>ff</td><td>ff</td><td>00</td><td>00</td><td>00</td><td>00</td><td>00</td><td>00</td><td>00</td><td>00</td></tr></table>

Non-critical Event Voltage Sensor Settings:
PEF Configuration Event Filter Data

<table><tr><td>05</td><td>80</td><td>11</td><td>01</td><td>08</td><td>ff</td><td>ff</td><td>02</td><td>ff</td><td>ff</td><td>ff</td><td>ff</td><td>00</td><td>00</td><td>00</td><td>00</td><td>00</td><td>00</td><td>00</td><td>00</td></tr></table>

Critical Event Voltage Sensor Settings:
PEF Configuration Event Filter Data

<table><tr><td>06</td><td>80</td><td>11</td><td>01</td><td>10</td><td>ff</td><td>ff</td><td>02</td><td>ff</td><td>ff</td><td>ff</td><td>ff</td><td>00</td><td>00</td><td>00</td><td>00</td><td>00</td><td>00</td><td>00</td><td>00</td><td>00</td></tr></table>

Non-recoverable Event Voltage Sensor Settings:
PEF Configuration Event Filter Data

<table><tr><td>07</td><td>80</td><td>11</td><td>01</td><td>20</td><td>ff</td><td>ff</td><td>02</td><td>ff</td><td>ff</td><td>ff</td><td>ff</td><td>00</td><td>00</td><td>00</td><td>00</td><td>00</td><td>00</td><td>00</td><td>00</td><td>00</td><td>0</td></tr></table>

# 4.7.2 Setting PEF with Shelf Manager Command Line

PEF settings can also be configured through the shelf manager command line. The ADLINK factory PEF settings are stored in /bin/adlink\_pef. If you wish to restore the ADLINK PEF default settings, login to the shelf manager command line and run script below:

```txt
#clear_event_filter
#destination_ip $IP(Alert IP as same as system manager IP)
#adlink_pef
```

# 4.7.3 Monitoring SNMP Trap Alerts

In order to monitor SNMP trap, users need to confirm the platform event trap format. The system manager recognizes format 0 only. The shelf manager default format is 0. To determine the current format, please enter the following command:

```txt
# clia getpefconfig pet_format
Pigeon Point Shelf Manager Command Line Interpreter
Platform Event Trap format: 0 (IPMI default)
#
```

If your current format is not 0, please configure the format to 0, otherwise the SNMP Trap Alerts function of the system manager will be disabled. To set the platform event trap format to 0, please enter the following command:

```txt
# clia setpefconfig pet_format 0
Pigeon Point Shelf Manager Command Line Interpreter
Platform Event Trap format set successfully
#
```

If properly configured, the System Manager will monitor and display all chassis information and board sensors. In order to do so, the System Manager must communicate properly with the snmp trap via IP.

To check the snmptc process, login to the target server command line and type:

```txt
#ps -ef | grep snmptc
```

![(root@localhost ~)# ps -ef | grep snmptc\nroot 1987 1 0 14:19 ?\nroot 2366 2350 0 14:47 pts/1 00:00:00 grep snmptc\n(root@localhost ~)#](.atca-system-manager-50-1g008-1000-200/1d606d62750edd4c340c8f1b4532e027ae6cf7ccad5497d7a2de0dbad0496da8.jpg)

If the system returns &lt; 00:00:00 snmptc &gt; your system is functioning normally. If not, you must check your host IP address.

The host computer IP address acts as the access point for the graphical user interface. The snmptc cannot auto-run unless the host PC has an IP address. To confirm the host computer's IP address, from the Linux command line under root type:

```txt
#ifconfig
```

Please record the resulting IP address for reference.

Once you have an IP address, manually start the &lt;snmptcd&gt; at the command line by typing:

```txt
#snmptcd start
```

<table><tr><td>File Edit View Terminal Tabs Help</td></tr><tr><td>[root@localhost ~]# ps -ef | grep snmptc root 2376 2350 0 14:48 pts/1 00:00:00 grep snmptc [root@localhost ~]# snmptcd start Starting snmptc ....... [root@localhost ~]# ps -ef | grep snmptc root 2388 1 0 14:49 ? 00:00:00 snmptc root 2392 2350 0 14:49 pts/1 00:00:00 grep snmptc [root@localhost ~]#</td></tr></table>

To confirm your settings type:

```txt
/etc/rc.local
```

Once the snmptc daemon is running properly, the System Manager can display SNMP Trap alerts for hotswap, temperature and voltage sensors. The following is an example of open handle alarms where Slot 8 has one sensor alert and the shelf manager has sent SNMP trap alerts to the System Manager (see Figure 4-10 below). To view sensor alert details, click the &lt;Sensor Alert Status&gt; area.

![Advanced TCA®\n①—② ③—④ ⑤ ⑥ ⑦—⑧ ⑨ ⑩ ⑪—⑫ ⑬—⑭\nM4 M4 M4 M4 M4 M4 M4 M4 M4 M4 M4\nM6\nAmmTOR AmmTOR AmmTOR AmmTOR AmmTOR AmmTOR AmmTOR AmmTOR AmmTOR AmmTOR AmmTOR AmmTOR AmmTOR\nM4\nB1: 3348 RPM\nB2: 3330 RPM\nS1: 5885 RPM\nS2: 6298 RPM\nTemp: 29 °C\nM4\nB1: 3816 RPM\nB2: 3798 RPM\nS1: 6298 RPM\nS2: 6573 RPM\nTemp: 27 °C\nM4\nB1: 3798 RPM\nB2: 3798 RPM\nS1: 6435 RPM\nS2: 6435 RPM\nTemp:26 °C](.atca-system-manager-50-1g008-1000-200/427f29ab22b46f96109b47f96ec13dc62ae25c47382268dafaed50d4ea9cd145.jpg)

Figure 4-10: Example of aTCA-8214 with Slot 8 Alarm Alert

# 5 Troubleshooting

This chapter provides tips and solutions to quickly solve possible system errors. If you are still experiencing problems, please contact the ADLINK FAE staff at: service@adlinktech.com.

<table><tr><td>System Error</td><td>Possible Cause(s)</td><td>Recommended Solution(s)</td></tr><tr><td rowspan="4">No ADLINK Chassis Found</td><td>Incorrect IP address</td><td>Check CMM IP and try again</td></tr><tr><td>Network unreachable between ADLINK chassis, ADLINK aTCA System Manager and/or your client/terminal PC</td><td>Check physical network connection(s)</td></tr><tr><td>Using old/outdated version of shelf manager on ADLINK chassis</td><td>Only use shelf manager version 2.5.2 or newer. Check version with &lt;#clia version &gt;command</td></tr><tr><td>Shelf FRU information is empty or incorrect</td><td>Check Shelf FRU information with &lt;#clia fruinfo 20 1&gt; command.The resulting information should include part number. If no information results, contact the FAE staff.</td></tr></table>

This page intentionally left blank.

# Getting Service

Contact us should you require any service or assistance.

# ADLINK Technology Inc.

Address: 9F, No.166 Jian Yi Road, Chungho City, Taipei County 235, Taiwan
台北縣中和市建一路 166 號 9 樓

Tel: +886-2-8226-5877

Fax: +886-2-8226-5717

Email: service@adlinktech.com

# Ampro ADLINK Technology Inc.

Address: 5215 Hellyer Avenue, #110, San Jose, CA 95138, USA

Tel: +1-408-360-0200

Toll Free: +1-800-966-5200 (USA only)

Fax: +1-408-360-0222

Email: info@adlinktech.com

# ADLINK Technology Beijing

Address: 北京市海淀区上地东路 1 号盈创动力大厦 E 座 801 室 (100085)
Rm. 801, Power Creative E, No. 1, B/D
Shang Di East Rd., Beijing 100085, China

Tel: +86-10-5885-8666

Fax: +86-10-5885-8625

Email: market@adlinktech.com

# ADLINK Technology Shanghai

Address: 上海市漕河泾高科技开发区钦江路 333 号 39 幢 4 层 (200233)

Tel: +86-21-6495-5210

Fax: +86-21-5450-0414

Email: market@adlinktech.com

# ADLINK Technology Shenzhen

Address: 深圳市南山区科技园南区高新南七道 数字技术园 A1 栋 2 楼 C 区 (518057)

2F, C Block, Bld. A1, Cyber-Tech Zone,

Gao Xin Ave. Sec 7, High-Tech Industrial Park S., Shenzhen, 518054 China

Tel: +86-755-2643-4858

Fax: +86-755-2664-6353

Email: market@adlinktech.com

# ADLINK Technology Inc. (German Liaison Office)

Address: Nord Carree 3, 40477 Duesseldorf, Germany

Tel: +49-211-495-5552

Fax: +49-211-495-5557

Email: emea@adlinktech.com

# ADLINK (French Liaison Office)

Address: 15 rue Emile Baudot, 91300 MASSY Cedex, France

Tel: +33 (0) 1 60 12 35 66

Fax: +33 (0) 1 60 12 35 66

Email: france@adlinktech.com

# ADLINK Technology Japan Corporation

Address: 151-0072 東京都渋谷区幡ヶ谷

1-1-2 朝日生命幡ヶ谷ビル 8F

Asahiseimei Hatagaya Bldg. 8F

1-1-2 Hatagaya, Shibuya-ku, Tokyo 151-0072, Japan

Tel: +81-3-4455-3722

Fax: +81-3-5333-6040

Email: japan@adlinktech.com

# ADLINK Technology Inc. (Korean Liaison Office)

Address:서울시 강남구 논현동 60-12 동성빌딩 4 층 402 호

No.402, Dongsung B/D, 60-12, Nonhyeon-Dong

Gangnam-gu, Seoul, 135-010, Korea.

Tel: +82-2-2057-0565

Fax: +82-2-2057-0563

Email: korea@adlinktech.com

# ADLINK Technology Singapore Pte Ltd.

Address: 84 Genting Lane #07-02A, Cityneon Design Centre, Singapore 349584

Tel: +65-6844-2261

Fax: +65-6844-2263

Email: singapore@adlinktech.com

# ADLINK Technology Singapore Pte Ltd. (Indian Liaison Office)

Address: No. 1357, "Anupama", Sri Aurobindo Marg, 9th Cross, JP Nagar Phase I, Bangalore - 560078, India

Tel: +91-80-65605817

Fax: +91-80-22443548

Email: india@adlinktech.com
[🔗 Link to the original document](.atca-system-manager-50-1g008-1000-200/atca-system-manager-50-1g008-1000-200.pdf)