# SDAQ-216/218

Standalone Ethernet DAQ for Distributed Machine Condition Monitoring

User's Manual

![Exterior view of a ADLINK SDAQ-216 networking device with visible ports and connectors (no readable text beyond branding)](.sdaq-216-218-50m-00120-1000-10/2f0b02309031fdc482a4bbb4371299f164a98e822e1ab6c0f9c8906b3ed40e81.jpg)

Manual Rev.: 1.0

Revision Date: March 20, 2023

Part No: 50M-00120-1000

Revision History

<table><tr><td>Revision</td><td>Release Date</td><td>Description of Change(s)</td></tr><tr><td>1.0</td><td>2023-03-20</td><td>Initial Release</td></tr></table>

# Preface

# Copyright © 2023 ADLINK Technology Inc.

This document contains proprietary information protected by copyright. All rights are reserved. No part of this manual may be reproduced by any mechanical, electronic, or other means in any form without prior written permission of the manufacturer.

# Disclaimer

The information in this document is subject to change without prior notice in order to improve reliability, design, and function and does not represent a commitment on the part of the manufacturer.

In no event will the manufacturer be liable for direct, indirect, special, incidental, or consequential damages arising out of the use or inability to use the product or documentation, even if advised of the possibility of such damages.

ADLINK is committed to fulfill its social responsibility to global environmental preservation through compliance with the European Union's Restriction of Hazardous Substances (RoHS) directive and Waste Electrical and Electronic Equipment (WEEE) directive. Environmental protection is a top priority for ADLINK. We have enforced measures to ensure that our products, manufacturing processes, components, and raw materials have as little impact on the environment as possible. When products are at their end of life, our customers are encouraged to dispose of them in accordance with the product disposal and/or recovery programs prescribed by their nation or company.

![Symbol of a trash bin crossed with a diagonal line, no text or labels present](.sdaq-216-218-50m-00120-1000-10/4c6f684af41b1acda847d88d9701a3b087009139c7faa574f1f7921b3e3f6b14.jpg)

Battery Labels (for products with battery)
![Symbol of a trash bin crossed out by two diagonal lines (no text or numbers present)](.sdaq-216-218-50m-00120-1000-10/88ac3a521ec25e08a25bc67acd97bb061353ddc14e048451446223d216276b9a.jpg)

![Recycling symbol icon with three chasing arrows inside a square frame (no text or labels)](.sdaq-216-218-50m-00120-1000-10/446f1db194920f801cd60c5cf703cdd965cdcca809c78c8aa529ad3e56630f46.jpg)

Li-ion

![RECYCLE\nRBRC\nLi-ion\n7.800.822.8837](.sdaq-216-218-50m-00120-1000-10/e87d85249391f8db42531710f685accf54424e097e513d2c16d1c29f691ea4c1.jpg)

![Abstract geometric pattern with interlocking X and Y shapes (no text or symbols)](.sdaq-216-218-50m-00120-1000-10/5790891d828fa63a47967e6032dc307aa9c451d968d791305ae88cff885223e2.jpg)

廢電池請回收

# California Proposition 65 Warning

![A yellow triangular warning sign with a black border and a black exclamation point in the center.](.sdaq-216-218-50m-00120-1000-10/69705c2aa64e887d30e0564b6d15d160ea52b089968f824507e7d4f821a8e0f3.jpg)

WARNING: This product can expose you to chemicals including acrylamide, arsenic, benzene, cadmium, Tris(1,3-dichloro-2-propyl)phosphate (TDCPP), 1,4-Dioxane, formaldehyde, lead, DEHP, styrene, DINP, BBP, PVC, and vinyl materials, which are known to the State of California to cause cancer, and acrylamide, benzene, cadmium, lead, mercury, phthalates, toluene, DEHP, DIDP, DnHP, DBP, BBP, PVC, and vinyl materials, which are known to the State of California to cause birth defects or other reproductive harm. For more information go to www.P65Warnings.ca.gov.

# Trademarks

Product names mentioned herein are used for identification purposes only and may be trademarks and/or registered trademarks of their respective companies.

# Conventions

Take note of the following conventions used throughout this manual to make sure that users perform certain tasks and instructions properly.

![The image displays a white document icon featuring a folded top-right corner and horizontal gray lines indicating text. A large, red checkmark is superimposed over the document.](.sdaq-216-218-50m-00120-1000-10/9ff3e1deeabeaa63294ff7617ef34c2ecabdc1b1531bbc7b29d8e82f08949b0e.jpg)
NOTE:

Additional information, aids, and tips that help users perform tasks.

![The image displays a standard yellow triangular warning sign with a thick black border. Centered within the triangle is a large, black exclamation mark. The sign is positioned against a plain white background.](.sdaq-216-218-50m-00120-1000-10/66236cea9605929298f2e771d252bee4b1886230d8565c168025e77e7957619e.jpg)
CAUTION:

Information to prevent minor physical injury, component damage, data loss, and/or program corruption when trying to complete a task.

![The image displays a red triangular warning sign with a black border. Inside the triangle is a white exclamation point. A horizontal black line runs across the very top edge of the image.](.sdaq-216-218-50m-00120-1000-10/a3be0e70a7040eb2c2cbfe030f3615e463ae8dc4772cccca49160ecb072d2475.jpg)
WARNING:

Information to prevent serious physical injury, component damage, data loss, and/or program corruption when trying to complete a specific task.

# Table of Contents

# Preface...... iii

# List of Figures ...... vii

# 1 Introduction ...... 1

1.1 Features.... 2
1.2 Applications 2
1.3 Specifications.... 3
1.4 Mechanical Drawings.... 7
1.5 I/O Connectors.... 14

# 2 Getting Started 19

2.1 Unpacking the SDAQ-216/218 19
2.2 Connecting to I/O.... 19
2.3 Connecting/Disconnecting Power 20
2.4 Checking Device Status.... 20
2.5 Usage Scenarios 20

# 3 DAQPilot.... 23

3.1 DAQPilot ACE 23
3.2 iApp Development and Device Management 24

# 4 Web Console.... 37

4.1 Web Console Login 37
4.2 Web Console Menu 40
4.3 DAQ Mission.... 55

# 5 DAQ Missions 67

5.1 Usage Behaviors 67
5.2 Custom Filtering Algorithms.... 70

Important Safety Instructions.... 73

Getting Service 75

# List of Figures

Figure 1-1: Front View ....7

Figure 1-2: Top View....8

Figure 1-3: Left Side View....9

Figure 1-4: Right Side View ...... 10

Figure 1-5: DIN Rail Mount Dimensions .... 11

Figure 1-6: Wall Mount Dimensions.... 12

Figure 1-7: Wall Mount Assembly 13

Figure 1-8: Analog Input/Output Connector 14

Figure 1-9: Digital Input/Output Connector 15

Figure 4-1: Web Console Login Page 38

Figure 4-2: Disabling DAQPilot Setting....39

Figure 4-3: Web Console Welcome Page....41

Figure 4-4: Menu Icon....41

Figure 4-5: System Information....42

Figure 4-6: Peripheral Devices 43

Figure 4-7: Data History....44

Figure 4-8: Mission Management 44

Figure 4-9: Change Password 45

Figure 4-10: Account Management....45

Figure 4-11: Network Settings 46

Figure 4-12: System Settings....47

Figure 4-13: Upload Customization/Firmware Files 48

Figure 4-14: TCP Socket 49

Figure 4-15: Modbus TCP Server 50

Figure 4-16: Data Types for Modbus TCP 51

Figure 4-17: Modbus TCP Created Data Types 52

Figure 4-18: Data Value Starting Address Allocation....53

Figure 4-19: Modbus Function Codes....54

Figure 4-20: Device Configuration 55

Figure 4-21: Post Trigger without Retrigger 56

Figure 4-22: Pre-trigger Mode Operation (valid trigger only) ..... 57

Figure 4-23: Pre-trigger Mode Operation (w/ invalid trigger) ..... 57

Figure 4-24: Delay-Trigger Mode Operation 58

Figure 4-25: Middle-Trigger Acquisition 58

Figure 4-26: Gated Trigger 59

Figure 4-27: DataType....61

Figure 4-28: Add Condition 63

Figure 4-29: Data Capture 64

Figure 4-30: Device Settings....65

Figure 4-31: Apply a New Mission 65

Figure 5-1: Operational Modes 68

Figure 5-2: RESTful API....68

Figure 5-3: DAQPilot Setting....69

# 1 Introduction

With the advent of IoT, more field devices are connecting to the Internet. Instead of being distributed at each field site, systems can be monitored and managed from a central control room. In this scenario, machine condition monitoring systems play a crucial role. Monitoring devices are typically deployed at the OT site, but by using an Ethernet-based data acquisition system (DAQ), machine conditions can be monitored remotely by IT staff.

The ADLINK SDAQ-216/218 is a standalone Ethernet DAQ that acquires voltage and current signals from a monitored machine which represent the machine status, with a threshold setting mechanism reporting important results to the backend server. This in turn dramatically reduces network bandwidth traffic as well as the backend server's computing burden.

The SDAQ-216/218 is designed for on-site process automation in the field. When recovering from a power failure, the system will automatically resume its previous running state. The SDAQ-216/218's compact size also makes it easy to install in the limited confines of an electrical control cabinet.

# 1.1 Features

▶ Standalone Ethernet DAQ for edge computing
▶ RESTful API reports machine conditions to IT system
▶ Built-in web console for easy configuration and to facilitate use as a portable DAQ
▶ Supports TCP socket (client mode) to transmit data actively
▶ Supports custom filtering algorithms for edge data
▶ 8- or 16-channel, 16-bit analog input up to 250 kS/s
▶ System automatically resumes its previous running state upon power recovery
▶ 1x RS-485 port for serial communication with Modbus RTU protocol
▶ 8-channel isolated digital input/output
▶ Two 1 Gb Ethernet ports for cascading

# 1.2 Applications

▶ Distributed machine condition monitoring
▶ Machine status detection through voltage and current signal

# 1.3 Specifications

# 1.3.1 General Specifications

<table><tr><td colspan="2">System Specifications</td></tr><tr><td>Ethernet (1 Gb)</td><td>2x RJ-45 Ethernet ports(1 IP, Ethernet cascade when powered on)</td></tr><tr><td>MCU</td><td>ARM Cortex A9 1.0 GHz</td></tr><tr><td>NAND Flash (eMMC)</td><td>32 GB</td></tr><tr><td>Memory</td><td>DDR3 RAM 1 GB</td></tr><tr><td>USB</td><td>2x USB 2.0 (for Wi-Fi dongle and USB storage only)</td></tr><tr><td>Power Supply</td><td>9 to 30V DC power input(optional: 40W AC-DC adapter, P/N 31-62138-0000)</td></tr><tr><td>Power Consumption</td><td>SDAQ-216: 5.5 W max.SDAQ-218: 6.7 W max.</td></tr><tr><td>Communication Interfaces</td><td>Web console, RESTful API, TCP socket (client mode), DAQPilot SDK</td></tr><tr><td>Digital Temperature Sensor (TI LMT01)</td><td>-50°C to 150°C (with 3 meter cable)</td></tr></table>

# 1.3.2 Analog Input

<table><tr><td colspan="2">Analog Input Specifications</td></tr><tr><td>Number of Channels</td><td>8 for SDAQ-218, 16 for SDAQ-216</td></tr><tr><td>Resolution</td><td>16-bit</td></tr><tr><td>Maximum Sampling Rate</td><td>250 kS/s and can be shared by selected channels.100 KHz for multi-channel gain queue</td></tr><tr><td>Input Range (voltage)</td><td>±10V, ±2.5V, ±1.25V, ±312.5mV</td></tr><tr><td>Input Range (current)</td><td>0 to 20mA</td></tr><tr><td>Input Configuration</td><td>16 single-ended, or 8 pseudo-differential</td></tr><tr><td>Input Coupling</td><td>DC</td></tr><tr><td>Input Impedance</td><td>1 GΩ, 249.0 Ω (input resistor) for current mode</td></tr><tr><td>Sensor Type</td><td>Voltage: 0.5 to 4.5V DC, 1 to 5V DC, 0 to 5V DC,0 to 10V DCCurrent: 4 to 20mA</td></tr><tr><td>Offset Error</td><td>Voltage mode: ±1 mV (± 10 V)Current mode: ±0.01 mA (typical)</td></tr><tr><td>Gain Error</td><td>Voltage mode: ±0.05% of FSR (± 10 V)Current mode: ±0.13% of FSR (typical)</td></tr><tr><td>-3dB Bandwidth</td><td>&gt;100 Hz</td></tr><tr><td>Flatness</td><td>±0.1dB (20 Hz to 30 KHz)</td></tr><tr><td>Trigger Sources</td><td>Software, digital trigger, analog trigger, built-in button</td></tr><tr><td>Overvoltage Protection</td><td>±15 V</td></tr><tr><td>Input Impedance</td><td>SDAQ-216: &gt;1G ohmSDAQ-218: ±249 ohms</td></tr><tr><td>CMRR</td><td>105 dB for ±1.25 V &amp; ±0.3125 V95 dB for ±2.5 V85 dB for ±10 V</td></tr><tr><td>SFDR</td><td>100 dB for ±10 V, Diff</td></tr><tr><td>THD</td><td>103 dB for ±10 V, Diff</td></tr><tr><td>SINAD</td><td>86 dB for ±10 V, Diff</td></tr><tr><td>SNR</td><td>87 dB for ±10 V, Diff</td></tr><tr><td>ENOB</td><td>14-bit for ±10 V, Diff</td></tr></table>

# 1.3.3 Isolated Digital I/O

<table><tr><td colspan="2">Isolated Digital I/O Specifications</td></tr><tr><td>Number of I/O</td><td>4-ch digital input and 4-ch digital output</td></tr><tr><td>Digital Type</td><td>TTL input: 0-5 V for DI / Open drain for DO</td></tr><tr><td>Input Logic Level</td><td>Logic low:  $VIL = 0.8$  V max.,  $IIL = 0.2$  mA max.Logic high:  $VIH = 2.0$  V min.,  $IIH = 0.2$  mA max.</td></tr><tr><td>Supplied Voltage</td><td>5 to 35V DC (for DO open drain)</td></tr><tr><td>Input Frequency Range</td><td>500 KHz for 1 μs pulse</td></tr><tr><td>Max. Sink Current</td><td>250 mA @ 100% duty (per channel)</td></tr><tr><td>Overvoltage Protection</td><td>DO: -50V to +50V; DI: 0V to +5V</td></tr><tr><td>Supported Modes</td><td>Static digital input/outputTachometer support (DI 0 only; range: 0.6 Hz to 500 kHz; 500 kHz for 1 microsecond)External digital trigger in</td></tr></table>

# 1.3.4 Analog Ouptut Specifications

<table><tr><td colspan="2">Analog Ouptut Specifications</td></tr><tr><td>Resolution</td><td>16-bit</td></tr><tr><td>Number of Channels</td><td>2 channels for voltage and current</td></tr><tr><td>Maximum Update Rate</td><td>100 Ksps and settling time 10 μs</td></tr><tr><td>Output Range</td><td>AO Current output: Maximum Load: 600 ohmAO Voltage Output Range: ±10 VAO Current Output Range: 0 to 20mA, No waveform generator support</td></tr><tr><td>AO Accuracy: Offset Error</td><td>Voltage mode: ±0.6mV, 2LSBCurrent mode: ±1μA, 3LSB</td></tr><tr><td>AO Accuracy: Gain Error</td><td>Voltage mode: ±0.05% FSRCurrent mode: ±0.05% FSR</td></tr><tr><td>INL</td><td>≤1LSB</td></tr><tr><td>DNL</td><td>≤1LSB</td></tr><tr><td>Output Driving Capacity</td><td>±5 mA</td></tr><tr><td>Slew Rate</td><td>2.0 V/μs</td></tr><tr><td>Settling Time(0.1% of Full Scale)</td><td>10 μs for 100 Ksps</td></tr><tr><td>Rising Time</td><td>10 μs</td></tr><tr><td>Falling Time</td><td>10 μs</td></tr></table>

# 1.3.5 Mechanical

<table><tr><td colspan="2">Mechanical Specifications</td></tr><tr><td>Dimensions</td><td>110.5 (L) x 40 (W) x 126.5 (H) mm</td></tr><tr><td>Connectors</td><td>2x 6-pin and 2x 14-pin spring-type terminal block</td></tr><tr><td>Front Panel LEDs</td><td>4</td></tr><tr><td>Housing</td><td>Metal, IP30</td></tr><tr><td>Mounting</td><td>DIN rail mount kit(optional: wall mount kit, P/N 34-51112-0000)</td></tr></table>

# 1.3.6 Environmental

<table><tr><td colspan="2">Environmental Specifications</td></tr><tr><td>Operating Temperature</td><td>0°C to 70°C (32°F to 158°F)</td></tr><tr><td>Storage Temperature</td><td>-20°C to 85°C (-4°F to 185°F)</td></tr><tr><td>Humidity</td><td>Approx. 95% @ 40°C (non-condensing)</td></tr><tr><td>Vibration</td><td>Operating: 5 Grms, 5-500 Hz, 3 axes</td></tr><tr><td>Shock</td><td>Operating: 100 G, half sine 11 ms duration</td></tr><tr><td>EMC</td><td>EN61000-6-4/EN61000-6-2</td></tr><tr><td>EMI</td><td>FCC Part 15B Class A, CISPR 32</td></tr><tr><td>EMS</td><td>IEC 61000-4-2 ESD: Contact: 4 kV; Air: 8 kVIEC 61000-4-3 RS: 80 MHz to 1.0 GHz, 10 V/mIEC 61000-4-4 EFT: Power: 2 kV; Signal 2 kVIEC 61000-4-5 Surge: Power 0.5 kV; Signal 1 kVIEC 61000-4-6 CS: 0.15 MHz to 80 MHz, 10 VIEC 61000-4-8 PFMF</td></tr><tr><td>Safety</td><td>IEC 61010-1, IEC 61010-2-201 (pending)</td></tr></table>

# 1.4 Mechanical Drawings

# 1.4.1 Dimensions
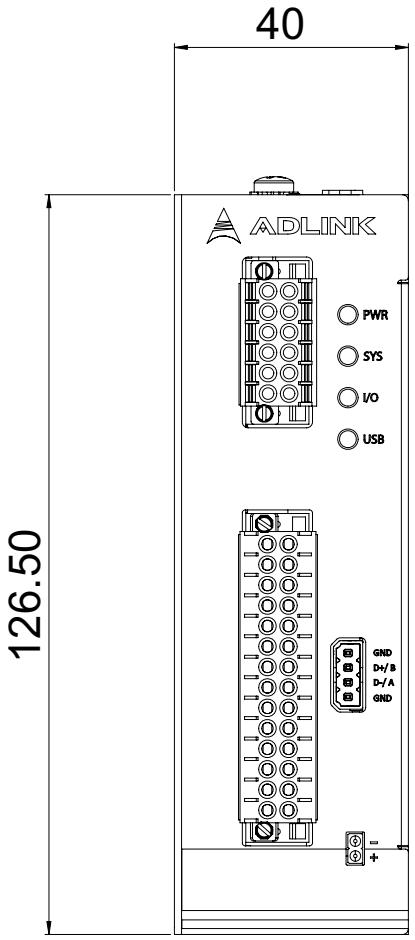
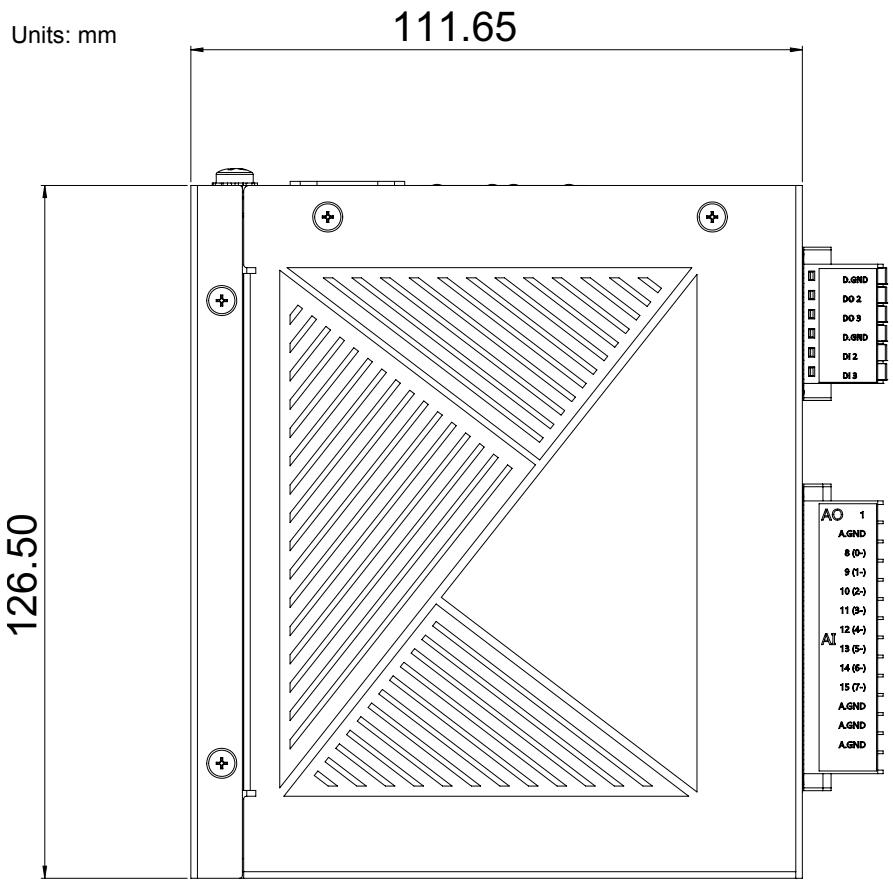
![40\nADLINK\nPWR\nSYS\nI/O\nUSB\n126.50\nGND\nD+/B\nD-/A\nGND\n+](.sdaq-216-218-50m-00120-1000-10/f5bcb2f38808c383145a7926b5196d34ebb208eb8302fd21b09fff8c543c531f.jpg)

Units: mm

Figure 1-1: Front View

Units: mm
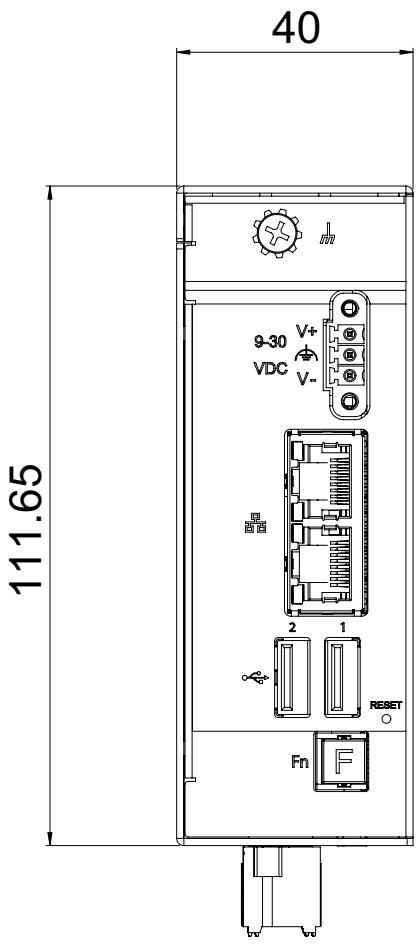
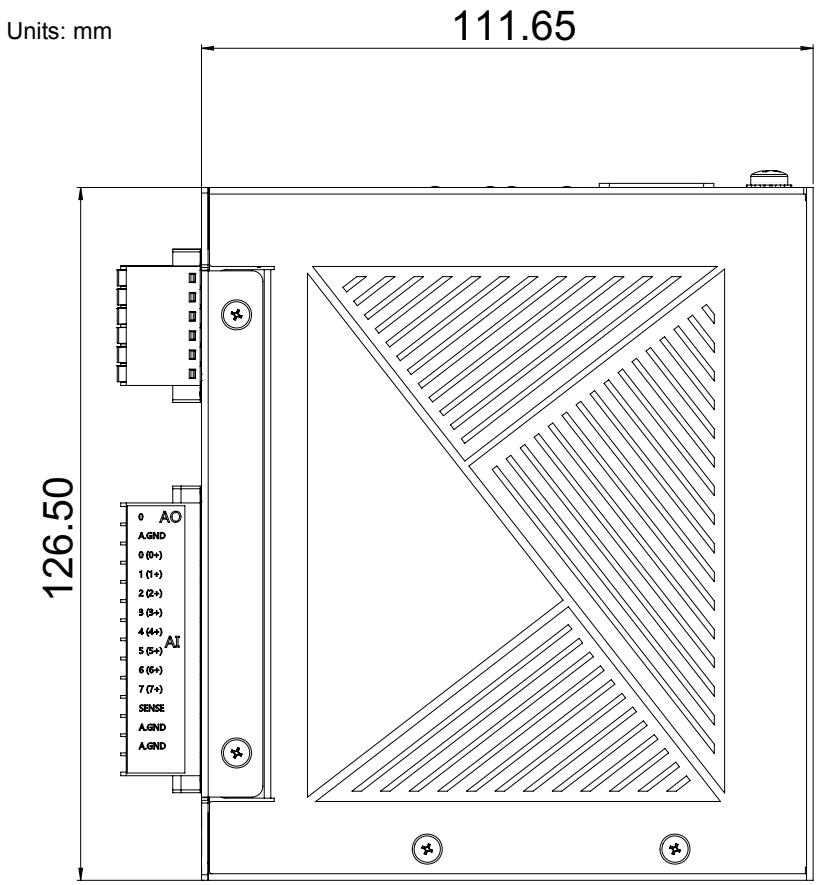
![40\n111.65\n9-30 V+\nVDC V-\n2 1\nRESET\nFn](.sdaq-216-218-50m-00120-1000-10/4c24a9fb24884bf5b23a335c1997cc2a2a3d986c892723240b5708e689540c19.jpg)

Figure 1-2: Top View

![Units: mm\n111.65\n126.50\nAO 1\nA.GND\n8 (0-)\n9 (1-)\n10 (2-)\n11 (3-)\n12 (4-)\n13 (5-)\n14 (6-)\n15 (7-)\nA.GND\nA.GND\nA.GND](.sdaq-216-218-50m-00120-1000-10/d748a50dbe5c3caebc8be97d405c32abc51de039880e0f584bd8239370383ab5.jpg)

Figure 1-3: Left Side View

![Units: mm\n111.65\n126.50\n0 AO\n0 AGND\n0 (0+)\n1 (1+)\n2 (2+)\n3 (3+)\n4 (4+)\n5 (5+)\n6 (6+)\n7 (7+)\nSENSE\nAGND\nAGND](.sdaq-216-218-50m-00120-1000-10/d4ba85f4713d137a181abf050d6faeca732f29965054d46bece7468ea55822e0.jpg)

Figure 1-4: Right Side View

# 1.4.2 DIN Rail Mount

The DIN rail mount may be attached to the SDAQ-216/218 using two flat head screws (included).
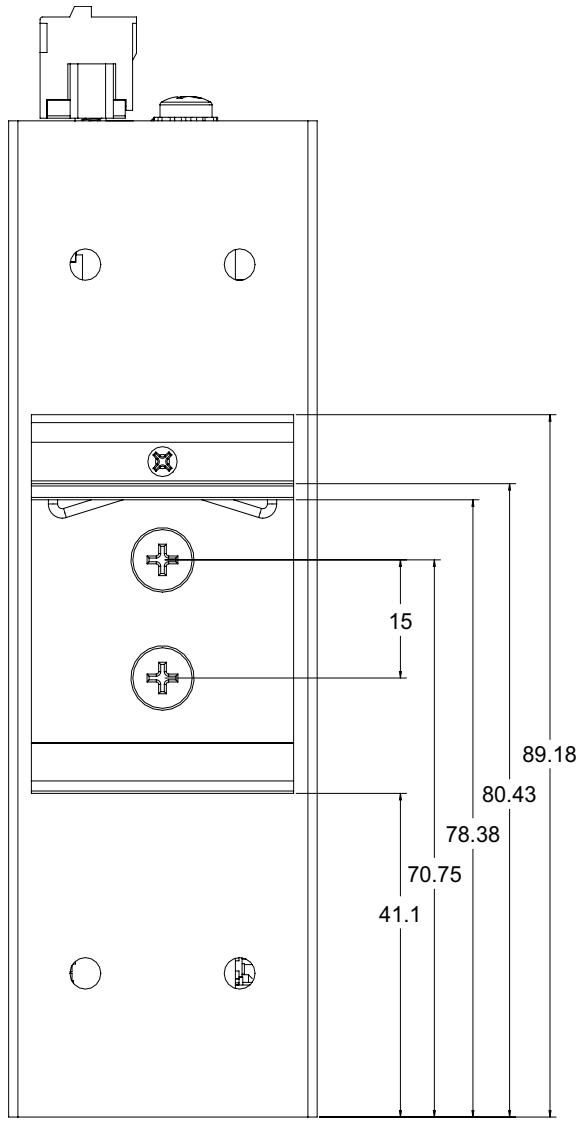
![15\n89.18\n80.43\n78.38\n70.75\n41.1](.sdaq-216-218-50m-00120-1000-10/e05530bff6c48e133ddc5f23e102f00c96a512b83bf66ca6728615aa7e52f7ef.jpg)

Figure 1-5: DIN Rail Mount Dimensions

Units: mm

# 1.4.3 Wall Mount

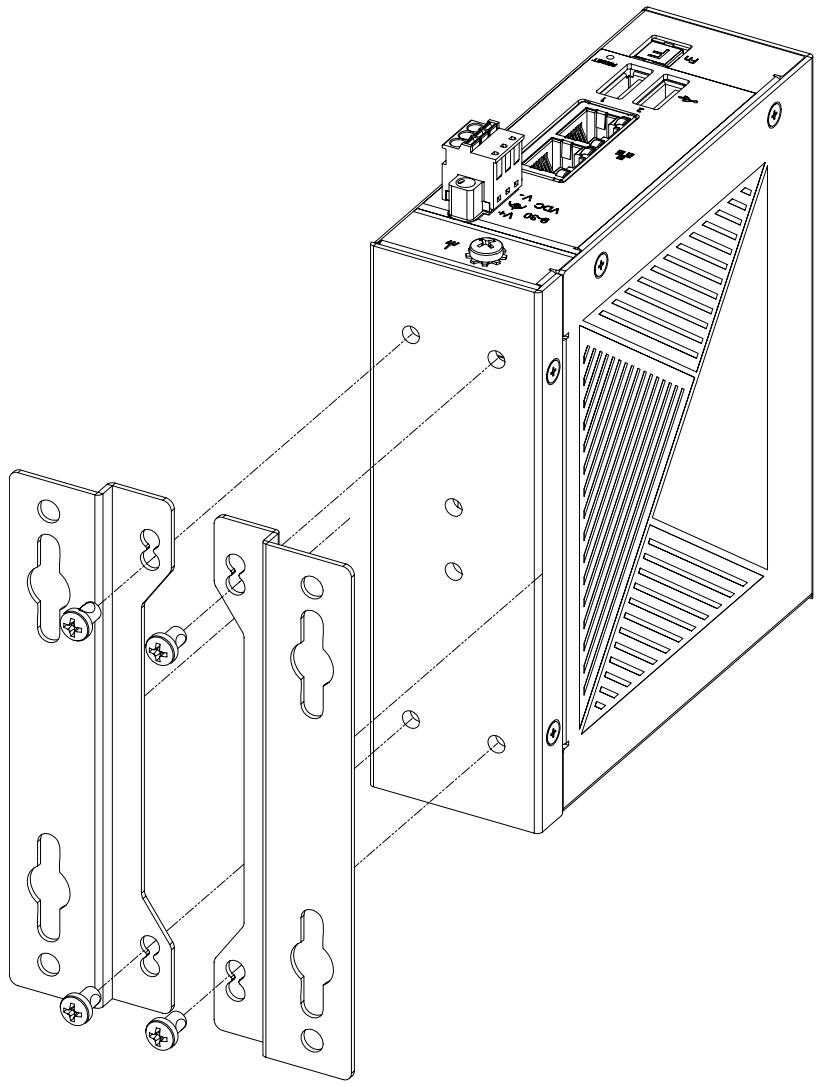
The optional wall mount bracket may be attached to the SDAQ-216/218 via four pan head screws (included with wall mount kit, P/N 34-51112-0000; see also Figure 1-7 on page 13).
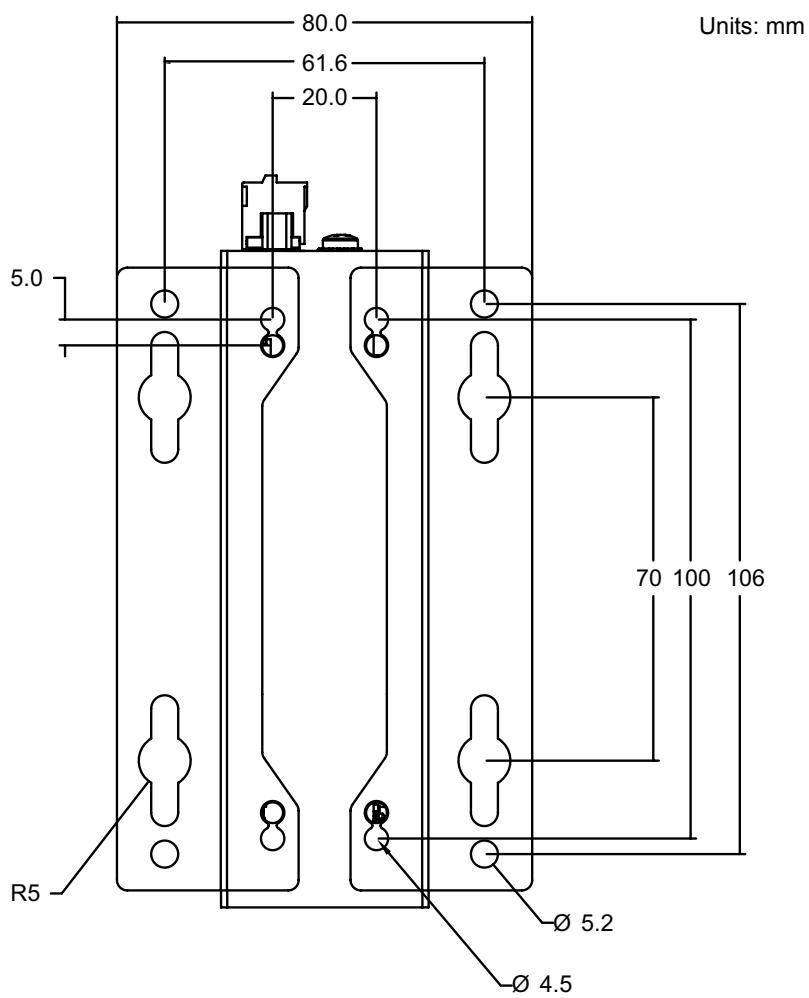
![80.0\n61.6\n20.0\n5.0\n70 100 106\nR5\nØ 5.2\nØ 4.5\nUnits: mm](.sdaq-216-218-50m-00120-1000-10/0b3a4768d301223baa070e8aab56028b315ed590ae04d4b745da4acf273cf159.jpg)

Figure 1-6: Wall Mount Dimensions

![Technical line drawing of an electronic device housing with mounting brackets and internal components (no text or symbols)](.sdaq-216-218-50m-00120-1000-10/fa3afe452e6ca2c1593ae4f0866ccb0b51becdac7fce0702ebae087b95f410ca.jpg)

Figure 1-7: Wall Mount Assembly

# 1.5 I/O Connectors

The SDAQ-216/218 provides rich peripherals, including:

▶ 8 or 16 analog inputs
▶ 4 digital input and 4 digital output connections
▶ 1 RS-485 port
▶ 1 temperature sensor input
▶ 2 USB 2.0 (for Wi-Fi dongle and USB storage only)
▶ 1 hotkey for triggering
▶ 1 reset pin for restoring the device to factory default settings
▶ 2 Ethernet ports for host connection and cascading
▶ 4 LED indicator lights

# 1.5.1 Analog Input and Analog Output

The SDAQ-216/218 module is equipped with a 2x14-pin terminal block for analog output and analog input. There are 2 analog output channels and 16 channels for analog input. The A.GND pin is for grounding.
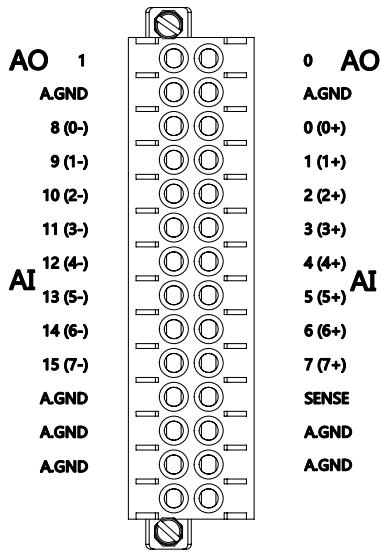
![AO 1\n0 AO\nA.GND A.GND\n8 (0-) 0 (0+)\n9 (1-) 1 (1+)\n10 (2-) 2 (2+)\n11 (3-) 3 (3+)\nAI 12 (4-) 4 (4+)\n13 (5-) 5 (5+)\n14 (6-) 6 (6+)\n15 (7-) 7 (7+)\nA.GND SENSE\nA.GND A.GND\nA.GND](.sdaq-216-218-50m-00120-1000-10/cfb9a7b22d1582aee22276e5d6fc35ed29b9b5d853ef849b34c9cf323748942b.jpg)

Figure 1-8: Analog Input/Output Connector

# 1.5.2 Digital Input and Output

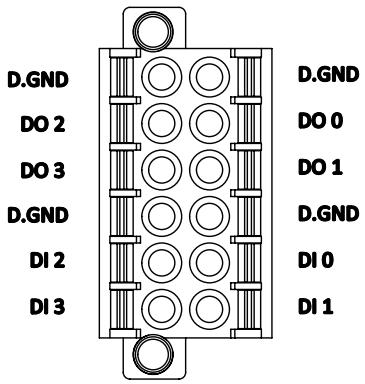
The SDAQ-216/218 provides 4 digital input and 4 digital output channels labeled DI and DO 0, 1, 2, and 3. Use D.GND for signal grounding with digital input/output. Use A.GND for signal grounding with analog input.
![D.GND\nDO 2\nDO 3\nD.GND\nDI 2\nDI 3\nD.GND\nDO 0\nDO 1\nD.GND\nDI 0\nDI 1](.sdaq-216-218-50m-00120-1000-10/908171723846010846dd7ed9567bd9673074e8598f31fadc4bb65b1b9f1e1e1d.jpg)

Figure 1-9: Digital Input/Output Connector

# 1.5.3 Temperature Sensor Input

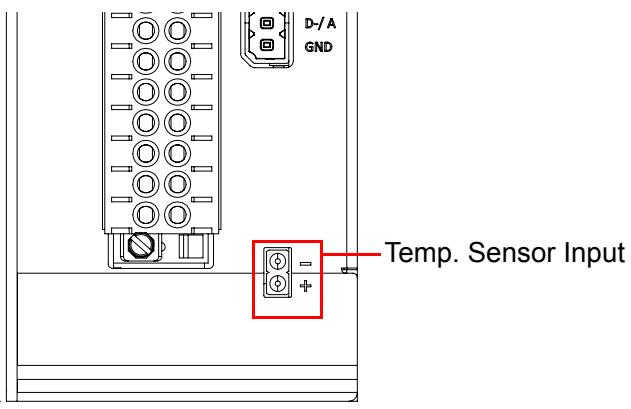
The SDAQ-216/218 allows you to monitor the temperature of a target device or environment between -50 to 150°C using the temperature sensor provided. Connect the temperature sensor leads to the connector as shown.
![D-/A\nGND\nTemp. Sensor Input](.sdaq-216-218-50m-00120-1000-10/f9f0b156227e0070cd5ecbec084405428c975bf804835d5e86b36c929200723b.jpg)

# 1.5.4 Reset Pin for Factory Default

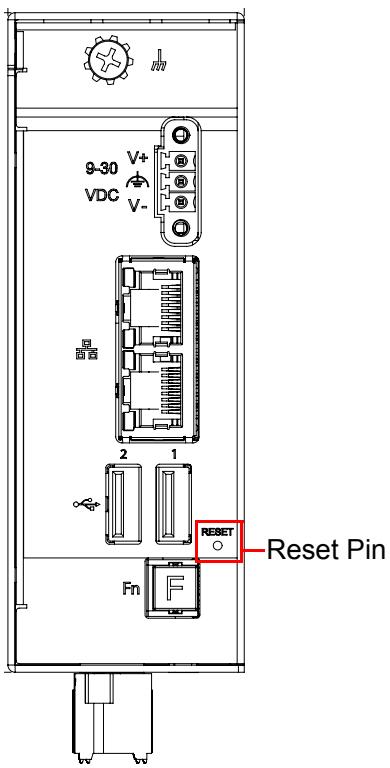
Restore the SDAQ-216/218 to its factory default settings using a paper clip or similar item inserted into the reset pin hole button and pressing the reset button for three seconds until the device reboots.

![The image displays a simple icon of a document or piece of paper. It features a folded top-right corner (dog-ear) and several horizontal lines running across the bottom, representing text. A large, bold red checkmark is superimposed over the left side of the document.](.sdaq-216-218-50m-00120-1000-10/1446cc93952711a24aa7a43d1a92a2728a53bbef1354b6de61de5d8f0bbe404d.jpg)
NOTE:

Users can optionally configure the SDAQ-216/218 to retain its current network settings rather than restoring the factory defaults. See “Web Console Login” on page 37.
![9-30 V+\nVDC V-\n2 1\nFN\nRESET Reset Pin](.sdaq-216-218-50m-00120-1000-10/c87081e1e27a50fbabc3f633f2daf6804991e33a8ebc2760466833a69d820368.jpg)

# 1.5.5 Ethernet Ports

The SDAQ-216/218 has two GbE ports with one MAC address. Either port can be used for connecting to a host PC, leaving the second port available for cascading. The default static IP address is 169.254.1.1.

<table><tr><td>LED1 (Amber)</td><td>LED2 (Green)</td><td>Link/Activity</td></tr><tr><td>OFF</td><td>OFF</td><td>Link off</td></tr><tr><td>OFF</td><td>ON</td><td>1000 Link/Activity (Tx, Rx)</td></tr><tr><td>ON</td><td>OFF</td><td>100 Link/Activity (Tx, Rx)</td></tr><tr><td>ON</td><td>ON</td><td>10 Link/Activity (Tx, Rx)</td></tr></table>

# 1.5.6 LED Indicators

The SDAQ-216/218 has four LEDs located on the front panel.

<table><tr><td>LED</td><td>Function</td><td>Description</td></tr><tr><td>PWR</td><td>Power input</td><td>▸ OFF: Device is not powered▸ Steady red: Device is powered</td></tr><tr><td>SYS</td><td>Boot up and system status</td><td>▸ OFF: Powered off▸ Flashing red, then steady red for about 35 seconds: Booting up▸ Steady green: System ready▸ Steady red: System errorNote: Connect the SDAQ-216/218 to a host PC via Ethernet cable before powering it on to bypass the three minute boot up process.</td></tr><tr><td>I/O</td><td>Analog input</td><td>▸ Flashing: Analog data is being captured▸ OFF: No data is being captured from FPGA</td></tr><tr><td>USB</td><td>USB Device</td><td>▸ Slow flashing green: A USB device is detected and ready to use.▸ Fast flashing green: Data read/write activity</td></tr></table>

# 1.5.7 USB Ports

USB ports can be used to add a Wi-Fi dongle. Contact your ADLINK sales representative for more information.

This page intentionally left blank.

# 2 Getting Started

# 2.1 Unpacking the SDAQ-216/218

Ensure that the following items are included in the package. If any items are missing, contact your sales representative for assistance.

▶ SDAQ-216/218
▶ DIN rail mount kit with 2x flat head screws
▶ Temperature sensor with 3 meter cable
▶ Quick Start Guide
▶ Optional accessories (if applicable):
▷ Wall mount kit with 4x pan head screws
▷ 40W AC-DC adapter

![The image displays a warning sign featuring a dark red triangle with a white border. Inside the triangle is a white exclamation point. Below the triangle, the word 'WARNING' is printed in black capital letters on a white background.](.sdaq-216-218-50m-00120-1000-10/1343ba5e0a131f0ed71333c1a2859495916f5aa06ae8eaf6c096a3f105b09692.jpg)

Before unpacking, check the shipping carton for any damage. If the shipping carton and/or contents are damaged, inform your dealer immediately. Retain the shipping carton and packing materials for inspection. Obtain authorization from your dealer before returning any product to ADLINK.

# 2.2 Connecting to I/O

1 For analog input, plug in the accelerometer with a BNC type connector.
2. For digital input or output, insert the signal wires into the terminal block.
3. Use a CAT 5 type Ethernet cable to connect a host PC to one of the Ethernet ports on the top panel. To create a daisy chain of multiple SDAQ-216/218 devices, use the second Ethernet port to cascade them together. Cascading reduces the number of ports needed to connect devices.

![The image displays a vertical safety warning label. At the top is a yellow equilateral triangle with a black border, featuring a large black exclamation point in the center. Directly beneath the triangle is a white rectangular section containing the text 'CAUTION:' printed in black, uppercase letters.](.sdaq-216-218-50m-00120-1000-10/2cb76395de5f17628d4a1bc4d0d9de674644b7409c25d130f5e84550350268fa.jpg)

If connecting SDAQ-216/218 devices in a daisy chain, only use a sequence configuration: do not use a ring configuration. A ring configuration will cause network communications to fail.

4. For temperature measurement, plug a two-pin temperature sensor connector into the front panel ports before attaching the temperature sensor to the target area to be measured.

# 2.3 Connecting/Disconnecting Power

1 Before turning on the power source, connect the positive and negative wires from a 9 to 30V DC power source to the terminal block.
2. Turn on the power source. If the power was connected correctly, the front panel red PWR LED will light up.

If the SDAQ-216/218 needs to be shut down, turn off the power source.

To remove the power wires, use a flat head screwdriver to push the orange slots on the terminal block and then pull out the wires.

![The image displays a standard safety warning sign. It features a yellow equilateral triangle with a black border, inside of which is a large black exclamation point. Below the triangle is a white rectangular area containing the text 'CAUTION:' in black capital letters.](.sdaq-216-218-50m-00120-1000-10/64b4820265afa8d7cd107698e04dbcc085839fc23d50db3dfa1e1e1eea4148e6.jpg)

Ensure the power source is turned off before connecting or removing the power wires.

# 2.4 Checking Device Status

1 When power is supplied, the PWR LED will be red. The SYS LED will initially blink red, then turn to a steady red for about 35 seconds, then change to a steady green indicating the device has successfully booted up.
2. Log into the device's web console for additional status information and configuration options. see "Web Console Login" on page 37.

# 2.5 Usage Scenarios

The SDAQ-216/218 is designed for distributed machine condition monitoring and can be used in many kinds of scenarios. Choose the most suitable scenario depending on the system infrastructure, data type, and frequency of data retrieval.

# 2.5.1 Deploy User-Developed Analytics Apps

The DAQPilot ACE software allows users to easily manage Smart DAQ devices and deploy user-developed applications on them.

DAQPilot ACE provides the following features:

▶ IDE for Python programming allowing users to develop and debug iApps remotely
▶ Provides a dashboard widget to show the data immediately
▶ Auto-discovers all supported devices on the local network
- Tags function allows users to identify or group multiple devices
▶ Deploys iApp to device via one-click function

For more information, see "DAQPilot" on page 23.

# 2.5.2 Configuration / Portable DAQ

Use the web console to configure device information, system settings, network settings, and test measurement analog input settings. For portable DAQ usage, the SDAQ-216/218 has a built-in dashboard to show the results of acquired data. The web-based console is also a convenient tool for users unfamiliar with DAQ behavior or programming. see "Web Console" on page 37.

# 2.5.3 Periodic Polling (REST API)

Many distributed machine condition monitoring applications acquire device status periodically, for example, every minute, or hourly. The SDAQ-216/218 retains captured data in the REST data format. Especially in IT systems, user applications frequently adopt REST APIs because they are intuitive. The SDAQ-216/218 emulates all functions supported by REST APIs, and the SDAQ-216/218 embedded middleware executes related operations and transfers the filtered data in JSON format. All queries from a REST command are handled by the SDAQ-216/218 and reply accordingly. see “DAQ Missions” on page 67.

# 2.5.4 Continuous Data (DAQPilot SDK)

Some applications need to acquire streaming data continuously. To transmit high volumes without data loss, raw data without any transformation is best. For users needing to access the DAQ library directly, the DAQPilot SDK is the proper method. By using the streaming API, all queried raw data may bypass the SDAQ-216/218's middleware and route directly to the host PC via Ethernet. see “Continuous Data” on page 69.

# 2.5.5 Passive Data (TCP Socket)

For passively retrieving data, it is suitable to use a TCP socket with the SDAQ-216/218 in client mode. Whenever data is generated, the SDAQ-216/218 will be triggered to establish a TCP connection with the host PC and actively transmit the data. see “Web Console” on page 37.

# 3 DAQPilot

DAQPilot is a software package for ADLINK DAQ products. It provides an integrated management utility that includes device management, iApp creation and allows deployment of user-defined data analytics to DAQ devices for enhanced smart capabilities and provides a unified SDK that allows users to stream continuous time-series data. The SDK is task-oriented and optimized for typical DAQ applications.

It available for download on the SDAQ-216/218 product web page:

SDAQ-216: https://www.adlinktech.com/Products/Data\_Acquisition/SmartDAQ/SDAQ-216

SDAQ-218: https://www.adlinktech.com/products/Data\_Acquisition/SmartDAQ/SDAQ-218

# 3.1 DAQPilot ACE

DAQPilot ACE is able to auto-discover all supported devices on the local network and features an intuitive user interface for providing device management functionalities including displaying device information, iApp deployment to devices and setting Tags to identify or group multiple devices. Tags are a convenient way for mass iApp deployment to grouped devices.

# 3.1.1 Installation

For optimal performance, make sure that the ACE software is properly installed on a client system computer that is properly linked with all ACE devices on the same LAN.

1. Install ACE devices.
2. Connect each ACE device to the same LAN with an Ethernet cable.
3. Power on each ACE device.

Note: It can take up to 2 minutes for the devices to link-up.

# 3.2 iApp Development and Device Management

ACE contains two major parts, iApp development and device management. This section includes a tutorial on how to create an iApp before deployment. iApps are saved in a repository and can be deployed to devices through the device management function.

# 3.2.1 iApp Development

Follow these steps to create a Python-based iApp.

1. Click iApp Creator from the left sidebar.

![ADLINK Connection Explorer Version: 22.10.1110\nDAQ Pilot\nDevice Manager\niApp Creator\nACE Handbook\nManage iApps\nRefresh iApps\nCreate iApp\niApp name ↑↓\nOperations\nOEE\nEdit iApp\nDelete iApp\nPower_Monitoring\nEdit iApp\nDelete iApp\nVibration\nEdit iApp\nDelete iApp](.sdaq-216-218-50m-00120-1000-10/7c382538ea95eae793b7703652bba4327904e0e4868f8fec7f3f5541d28dd9ce.jpg)

# 2. Click Create iApp to create a new iApp.

![ADLINK Connection Explorer Version: 22.10.1110\nDAQ Pilot\nDevice Manager\niApp Creator\nACE Handbook\nManage iApps\nRefresh iApps\nCreate iApp\niApp name ↑↓\nOperations\nOEE\nEdit iApp Delete iApp\nPower_Monitoring\nEdit iApp Delete iApp\nVibration\nEdit iApp Delete iApp](.sdaq-216-218-50m-00120-1000-10/ce9286f5a1e39b1cb2155bf7dbe1e23f8946e52bd6cd7865ffd2850793b93403.jpg)

# 3. Enter a name in the iApp name textbox.

![Create iApp\nName: iApp name\nSelect a template: Simpleio AI\nEmpty\nSimpleio AI\nREST server\nREST client\nDASK AI\nDASK AO\n✓ Create](.sdaq-216-218-50m-00120-1000-10/4264b24cec507041ae6e48ca008de059bf8bc4072f16cce4bbaf092fce064ced.jpg)

4. Select an iApp template to start from. A new iApp will be automatically loaded into the editor.

# Create iApp

![The image features two 'X' symbols arranged horizontally.](.sdaq-216-218-50m-00120-1000-10/31bd9fed707fa71fdbd44b43baa1c6985232d5c44df58f8f9602e1398d1075a3.jpg)

Name:

Vibration

Select a template: Simpleio AI

Empty

Simpleio AI

REST server

REST client

DASK AI

DASK AO

![The image displays a rectangular button with rounded corners featuring a blue-grey background. Inside the button, there is a white checkmark icon followed by the word 'Create' in white text. The button is highlighted by a thick red border surrounding it.](.sdaq-216-218-50m-00120-1000-10/2ee5c8a275e7bfd6834c4527064948042afc42a3c19c44c7c56c582f3b3f7c2f.jpg)

5. Edit the iApp as necessary.

![main.py\ncount_1 = AI_Count(001)\ncount_2 = AI_count(002)\ntime_3 = AI_time(001, 2000)\ntime_4 = AI_time(001, 2000)\ntime_5 = AI_time(002, 2000)\nACPer = (x * 25 for x in CMX(0-159))\nrun = np vibration.wan(np.array(001)**)\npowerVoltage = run*(0.1)\nsimple1 could plot 'Throughput Product Line1 (CKS): 'est(count_2))\nsimple1 could plot 'Throughput Product Line2 (CKS): 'est(count_3)\nsimple1 could plot 'Run (ms): 'est(Time_0))\nsimple1 could plot 'Idle (ms): 'est(Time_1))\nsimple1 could plot 'Error (ms): 'est(Time_2))\nsimple1 could plot 'Power Run(V): 'est(PowerVoltage))\nsimple1 could plot_graph(001, 'Throughput Product Line1', 'Voltage')\nsimple1 could plot_graph(002, 'Throughput Product Line2', 'Voltage')\nsimple1 could plot_graph(ACPer, 'ACPer', 'Voltage')\nsimple1 could plot_graph(003, 'Run', 'Voltage')\nsimple1 could plot_graph(004, 'Idle', 'Voltage')\ndata = ()\ndata(CEE_1) = Time_0\ndata(CEE_2) = Time_1\ndata(CEE_3) = Time_2\ndata(Count_1) = count_3\ndata(Count_2) = count_4\ndata(ACPer voltage) = powerVoltage\ndata(ACPer subtris) = ACPer](.sdaq-216-218-50m-00120-1000-10/79321c72f45d5e044cf08b781dc8466f48b91e2f212e5c5be31e5165f8423e35.jpg)

6. Click Save iApp when editing is completed.

![select Device ) Run Stop Console\nmain.py\ncount_3 = AI_Count(OM)\ncount_4 = AI_Count(OM)\ntime_0 = AI_Time(OM, 2000)\ntime_1 = AI_time(OM, 2000)\ntime_2 = AI_time(OM, 2000)\nACPer = ( * PS for x in OM(0:150))\nrun = np.spr(yn.mean(np.array(OM)**2)))\npowerVoltage = np*0.1)\nsimple1 could_print('Throughput Product time1 (953)'; *str((count_1)))\nsimple1 could_print('Throughput Product time1 (953)'; *str((count_2)))\nsimple1 could_print('run (m): 'str((time_0)))\nsimple1 could_print('idle (m): 'str((time_1)))\nsimple1 could_print('error (m): 'str((time_2)))\nsimple1 could_print('power run): *str((powerVoltage))\nsimple1 could_print.graph(OM), 'Throughput Product time1', 'voltage')\nsimple1 could_print.graph(OM), 'Throughput Product time1', 'voltage')\nsimple1 could_print.graph(ACPer, 'ACPer', 'Voltage')\nsimple1 could_print.graph(OM, 'Run', 'voltage')\nsimple1 could_print.graph(OM, 'tile', 'voltage')\ndata = ()\ndata( (OR_1) ) = Time_0\ndata( (OR_2) ) = Time_1\ndata( (OR_3) ) = Time_3\ndata( (Count_low) ) = count_3\ndata( (Count字号) ) = count_4\ndata( ACPer/voltage ) = powerVoltage\ndata( ACPer/output) = ACPer](.sdaq-216-218-50m-00120-1000-10/606638f43e331ccd15da1b74f92ea2a62b102eaf86634c3edac7d711a473ab70.jpg)

# 3.2.2 iApp Deployment

Follow these steps to deploy an iApp.

1. Click Select Device on the menu bar.

![DAQ Pilot\nDevice Manager\nApp Creator\nACE Handbook\nOEE\nSelect Device\n1.08PC1001 (ADJNK,SDAG-216,Timer-Light)\nK7R5E1C1010 (ADJNK,SDAG-204,Motor)\nMX043NCA21 (ADJNK,SDAG-216,Power-Source)\ncount_3 = AI_Count(CK)\ncount_d = AI_Count(OM)\ntime_0 = AI_time(OK, 2000)\ntime_1 = AI_time(OK, 2000)\ntime_2 = AI_time(OK, 2000)\nACDVar = (e * p for i x in OMS(bit))\nreq = np.iqtr(np.mean(np.array(OK)**2))\npowerVoltage = req*3L...\nsimplel.comscale.print('Throughput Product Line1 (PK3): *str(count_3))\nsimplel.comscale.print('Throughput Product Line2 (PK3): *str(count_4))\nsimplel.comscale.print('new (ms): *str(time_0))\nsimplel.comscale.print('file (ms): *str(time_1))\nsimplel.comscale.print('true (ms): *str(time_2))\nsimplel.comscale.print('power res(v): *str(powerVoltage))\nsimplel.comscale.plot_graph(OK), 'Throughput Product Line1', 'Voltage')\nsimplel.comscale.plot_graph(OK), 'Throughput Product Line2', 'Voltage')\nsimplel.comscale.plot_graph(OK), 'ACDVar', 'Voltage'\nsimplel.comscale.plot_graph(OK, 'Bus', 'Voltage')\nsimplel.comscale.plot_graph(OK, 'Title', 'Voltage')\ndata ( 1)\ndata('IOE_v') = Time_0\ndata('IOE_v') = Time_1\ndata('IOE_v') = Time_2\ndata('count_low') = count_3\ndata('count_nlgm') = count_4\ndata('ACDVar,nlgm') = powerVoltage\ndata('ACDVar,nlgm') = ACDVar](.sdaq-216-218-50m-00120-1000-10/60c9d2adfafd93ff94ba418c4fa5780f0df553379df40d06a81793bd19c75ac2.jpg)

# 2. Select the target device to be deployed.

![DAQ Pilot\nDevice Manager\nApp Creator\nACE Handbook\nOEE\nSelect Device Run Stop Console\n100PC1001 (DAQLIK.SDAQ-218, Tower-Light)\nK7R5C1010 (DAQLIK.SDAQ-204.Motor)\nM50A9CA91 (DAQLIK.SDAQ-218, Power-Source)\ncount_3 = AI_count(OM)\ncount_d = AI_count(OM)\ntime_0 = AI_time(OM, 2000)\ntime_1 = AI_time(OM, 2000)\ntime_2 = AI_time(OM, 2000)\nACPw = (x * 25 for x in OM(0:150))\nms = np.sqrt(np.mm(np.array(OM))^{*})\npowerVillage = ms^25.1\nsimple1 could print throughput Product limit (PCS): *str(count_3))\nsimple1 could print throughput product limit (PCS): *str(count_4))\nsimple1 could print run (m): *str(Time_8))\nsimple1 could plot time (ms): *str(Time_1))\nsimple1 could plot time run (ms): *str(Time_2))\nsimple1 could plot user run (ms): *str(powerVillage))\nsimple1 could plot graph(OM), 'throughput Product limit', 'voltage'\nsimple1 could plot graph(OM), 'throughput Product limit', 'voltage'\nsimple1 could plot graph(OM, 'Power', 'Voltage')\nsimple1 could plot graph(OM, 'Run', 'voltage')\nsimple1 could plot graph(OM, 'min', 'voltage')\ndata = ()\ndata('OB_t') = time_0\ndata('OB_t') = time_1\ndata('OB_t') = time_3\ndata('Count_Lim') = count_3\ndata('Count_Slight') = count_4\ndata('ACPower_Litage') = powerVillage\ndata('ACPower_Litdata') = ACPw\ntag=1](.sdaq-216-218-50m-00120-1000-10/b18f839abc6891be9f0f2f3c7b8e2a16b6f8491e08dc0e365e602e06e15c486c.jpg)

# 3. Click Run and wait for the deployment to finish.

![Deploying iApp into device...\nOEE\niApp deployed](.sdaq-216-218-50m-00120-1000-10/14faafbc6d6d78d2a01380191bcca9e79a7254343ced3103e1cd8276f14607ca.jpg)

# 4. Click Console on the menu bar.

![OEE\nL10BPC1001(ADLINK.SDAQ-216.Tower-Light) Select Device Run Stop Console\nmain.py\n78 count_3 = AI_count(OH)\n79 count_4 = AI_Count(OH)\n80 Time_0 = AI_Time(OH, 2000)\n81 Time_1 = AI_Time(OH, 2000)\n82 Time_2 = AI_Time(OH, 2000)\n83 ACPower = (x * 25 for x in CHD(0:150))\n84 rms = np.iqtr(np.mean(np.array(OH)**2))\n85 powerVoltage = rms*35.3\n86 simpleioConsole.print('Throughput Product Line1 (PCS): *str(count_3))\n87 simpleioConsole.print('Throughput Product Line2 (PCS): *str(count_4))\n88 simpleioConsole.print('Run (ms): *str(Time_0))\n89 simpleioConsole.print('Idle (ms): *str(Time_1))\n90 simpleioConsole.print('Error (ms): *str(Time_2))\n91 simpleioConsole.print('power rms(V): *str(powerVoltage))\n92 simpleioConsole.plot_graph(OH), 'Throughput Product Line1', 'Voltage')\n93 simpleioConsole.plot_graph(OH), 'Throughput Product Line2', 'Voltage')\n94 simpleioConsole.plot_graph(ACPower, 'ACPower'), 'Voltage')\n95 simpleioConsole.plot_graph(OH), 'Run', 'Voltage')\n96 simpleioConsole.plot_graph(OH), 'Idle', 'Voltage')\n97 data - ()\n98 data('OEE_G') = Time_0\n99 data('OEE_V') = Time_1\n100 data('OEE_A') = Time_2\n101 data('Count_lmd') = count_3\n102 data('Count_Hight') = count_4\n103 data('ACPower_Voltage') = powerVoltage\n104 data('ACPower_RainData') = ACPower\n105 try](.sdaq-216-218-50m-00120-1000-10/b64cbb4c772dadec1c2cadea12cfc5afb35b23eed0b36084684f9e2abe1f67fc.jpg)

# 5. Console view shows that the iApp deployed to the remote device is running.

```txt
Console
L108PC1001(mcm204): Error (ms): 0.0
L108PC1001(mcm204): power rms(V): 227.17853736703296
L108PC1001(mcm204): requests data
L108PC1001(mcm204): Throughput Product Line1 (PCS): 0
L108PC1001(mcm204): Throughput Product Line2 (PCS): 0
L108PC1001(mcm204): Run (ms): 0.0
L108PC1001(mcm204): Idle (ms): 0.0
L108PC1001(mcm204): Error (ms): 0.0
L108PC1001(mcm204): power rms(V): 227.2169433184742
L108PC1001(mcm204): requests data
```

# 3.2.3 Device Management

Follow these steps to deploy an iApp to a single device.

1. Click Device Manager on the the left sidebar.

![DAQ Pilot\nDevice Manager\nApp Creator\nACE Handbook\nManage Devices\nRefresh devices\nDevice ID 11\nIP/MAC Address\nTags\nCurrent iApps\nL108PC1001\n169.254.1.91\n02:42:47c3.977zd\nADLINK SDAQ-21B Tower-Light\nOEE\nK785E1010\n169.254.1.30\n02:42:70c3.9779\nADLINK SDAQ-20A Motor\nVibration\nM5043NCA01\n169.254.1.506\n02:42:sh99-oc-33\nADLINK SDAQ-21B Power-Sound\nPower_Monitoring](.sdaq-216-218-50m-00120-1000-10/e4c956dc27a33f5bda75ec805fd3ad81f9968696059ed73fcc4c4a29fbad54ce.jpg)

2. For a targeted device, click Choose iApp.

![Current iApps\niApp Status ↑↓\nDeploy\nOEE\nrunning\nChoose iApp\nVibration\niApp name ↑↓\nOEE\nPower_Monitoring\nVibration](.sdaq-216-218-50m-00120-1000-10/dbe6e6b8ce3bdd8e434b7e0441bf0cabbb8562a3ba2020db02469ffb25d6cb23.jpg)

3. Select a target iApp to deploy to start deployment.

![Current iApps\niApp Status ↑↓\nDeploy\nOEE\nrunning\nChoose iApp\nVibration\niApp name ↑↓\nPower_Monitoring\nOEE\nPower_Monitoring\nVibration](.sdaq-216-218-50m-00120-1000-10/9f01e91d0c1855f37375a39a03a5383310e539ab0ebf30bfc38c003a8a6e607f.jpg)

4. The selected iApp is deployed to the target device.

# 3.2.4 Assign Tags to Devices

Tags can be assigned to devices for device naming or mass deployment. Follow these steps to assign a name to a device.

1. Click Device Manager on the left sidebar.

![DAQ Pilot\nDevice Manager\nApp Creator\nACL Handbook\nManage Devices\nRefresh devices\nDeploy by tags\nDevice ID 11\nIP/MAC Address\nTags\nCurrent Apps\nL108PC1001\n169.254.1.91\n02.42.47c3.97c78\nADLINK\nSDAQ-218\nTower-Light\nDEE\nKT856C1010\n169.254.1.30\n02.42.7c7c7.8779\nADLINK\nSDAQ-204\nMotor\nVibration\nM5043NCA01\n169.254.1.106\n02.42.4b9.8c.33\nADLINK\nSDAQ-218\nPower Source\nPower_Monitoring](.sdaq-216-218-50m-00120-1000-10/c616aaabf3706cc87dc803bd36dbbef45d984a172526eda98ac90edc6a39e43a.jpg)

2. To select a targeted device, click the dropdown menu under Tags.

![Manage Devices\nRefresh devices\nDeploy by tags\nDevice ID ↑↓\nIP/MAC Address\nTags\nCurrent iApps\niApp Status ↑↓\nDeploy\nL108PC1001\n169.254.1.91\n02.42.41c3.97cd\nADLRK SEAQ-218 Tower Light\nOKE\nrunning\nChese App\nK7836C1010\n169.254.1.30\n02.42.70c1.4779\nSelect Tags\nVibration\nrunning\nChese App\nM5043NCA01\n169.254.1.106\n02.42.e8e8b.0c33\nADLRK\nPower_Monitoring\nrunning\nChese App](.sdaq-216-218-50m-00120-1000-10/4c5cd7b2019e448757c7d3acb409b84bda12cc04a49928b4cfd6eb7b37823426.jpg)

![DAQ Pilot\nManage Devices\nRefresh Devices\nDisplay by steps\nDevice ID\nIP/MAC Address\nTags\nCurrent type\nIApp Status\nDisplay\n1.000PC7035\n168.254.130\n52.40.41.9.37E7.62\n168.254.130\n52.40.41.9.37E7.62\n168.254.130\n52.40.41.9.37E7.62\n168.254.130\n52.40.41.9.37E7.62\n168.264.130\n52.40.41.9.37E7.62\n168.264.130\n52.40.41.9.37E7.62\n168.264.130\n52.40.41.9.37E7.62\n168.264.130\nLED Chip\nLED Chip\nLED Chip\nLED Chip\nLED Chip\nLED Chip\nLED Chip\nLED Chip\nLED Chip\nLED Chip\nLED Chip\nLED Chip\nLED Chip\nLED Chip\nLED Chip\nLED Chip\nLED Chip\nLED Chip\nLED Chip\nLED Chip\nLED Chip\nLED Chip\nLED Chip\nLED Chip\nLED Chip\nLED Chip\nLED Chip\nLED Chip\nLED Chip\nLED Chip\nLED Chip\nLED Chip\nLED Chip\nLED Chip](.sdaq-216-218-50m-00120-1000-10/6ebe269e28422a84e60131c92bd6871973061e1ccd17847ee57342e7ad9bfcab.jpg)

3. Select a tag to list the devices.

![DAQ Pilot\nManage Devices\nSoftware Manager\nDevice ID: 100\nRT-MAE Address\nTags\nRT-MAE Address\nCurrent Style\nApp Status\nDisplay\n1.000000000\n100 2543.91\n03.42.451.58756\nRT-MAE Address\nRT-MAE Address\nRT-MAE Address\nRT-MAE Address\nRT-MAE Address\nRT-MAE Address\nRT-MAE Address\nRT-MAE Address\nRT-MAE Address\nRT-MAE Address\nRT-MAE Address\nRT-MAE Address\nRT-MAE Address\nRT-MAE Address\nRT-MAE Address\nRT-MAE Address\nRT-MAE Address\nRT-MSAENZAATI\n100 2543.91\n03.42.451.58756\nRT-MAE Address\nRT-MAE Address\nRT-MAE Address\nRT-MAE Address\nRT-MAE Address\nRT-MAE Address\nRT-MAE Address\nRT-MAE Address\nRT-MAE Address\nRT-MAE Address\nRT-MAE Address\nRT-MAE Website\nRT-MAE Website\nRT-MAE Website\nRT-MAE Website\nRT-MAE Website\nRT-MAE Website\nRT-MAE Website\nRT-MAE Website\nRT-MAE Website\nRT-MAE Website\nRT-MAE Website\nRT-MAE Website\nRT-MAE Website\nRT-MAE Website\nRT-MAE Website\nRT-MAE Website\nRT-MAE Website\nRT-MSAENZAATI\n100 2543.91\n03.42.451.58756\nRT-MAE Address\nRSNCAENZAATI\nRSNCAENZAATI\nRSNCAENZAATI\nRSNCAENZAATI\nRSNCAENZAATI\nRSNCAENZAATI\nRSNCAENZAATI\nRSNCAENZAATI](.sdaq-216-218-50m-00120-1000-10/6832b5e731ae8304abb05d95b5c485f69f5c1ef5665b4cfae28eacdc507842bf.jpg)

4. To create new tag, click +, and then save it.

![ADLINK Connection Explorer Version: 22.10.1110\nDAQ Pilot\nDevice Manager\niApp Creator\nACE Handbook\nManage Devices\nRefresh devices\nDevice ID ↑↓\nIP/MAC Address\nL108PC1001\n169.254.1.91\n02-42:a9:c3:97:cd\nK785EC1010\n169.254.1.30\n02-42:7c:fc:d7:79\nM9043NCA01\n169.254.1.106\n02-42:a9:d9:dc:33\nTags\nADLINK SDAQ-218 Tower-Light\nADLINK\nSDAQ-204\nNo results found](.sdaq-216-218-50m-00120-1000-10/082e26d71b38c9428ea7a9c8672a9e499d6be94f8dc8cc6b0ebebafe7d289b37.jpg)

ADLINK Connection Explorer Version: 22.10.1110

![DAQ Pilot\nDevice Manager\niApp Creator\nACE Handbook\nManage Devices\nRefresh devices\nDevice ID ↑↓\nIP/MAC Address\nTags\nL108PC1001\n169.254.1.91\n02:42:4f:c3:97:cd\nADLINK SDAQ-218 Tower-Light\nK785EC1010\n169.254.1.30\n02:42:7c:fc:d7:79\nADLINK SDAQ-204\nM9043NCA01\n169.254.1.106\n02:42:a9:d9:dc:33\nPower-Source\nSDAQ-204\nDeploy by tags](.sdaq-216-218-50m-00120-1000-10/90825cd34065dd6c33229835b5a309aa96939c5c322625b33533bfdf9f29e806.jpg)

![Confirm\nSave tags?\n× No ✓ Yes](.sdaq-216-218-50m-00120-1000-10/fc1780b009fa661455e7c67a3f054a4bc307e8d2ef175125805afe107e97fded.jpg)

# 3.2.5 Deploy an iApp to Multiple Devices with Tags

Follow these steps to deploy an iapp to multiple devices with tags.

1. Click Device Manager on the left sidebar.

![DAQ Pilot\nDevice Manager\niApp Creator\nACE Handbook\nManage Devices\nRefresh devices\nTag\nDisplay by tags\nDevice ID ↑↓\nIP/MAC Address\nTags\nCurrent Apps\nL108PC1001\n169.254.1.93\n02:42.47:3.87c70\nADLINK  SDAQ-218  Tower-Light\nOEE\nKT856C1010\n169.254.1.30\n02:42.7c7c7c779\nADLINK  SDAQ-204  Motor\nVibration\nM9043NCA01\n169.254.1.06\n02:42.4b:89bc33\nADLINK  SDAQ-218  Power Static\nPower_Monitoring](.sdaq-216-218-50m-00120-1000-10/4d1106c9cf98a557221e57649cc16b121dc6cca621e2ef9e572dc078936e952c.jpg)

2. Click Deploy by tags.

![DAQ Pilot\nDevice Manager\ni-App Creator\nACE Handbook\nManage Devices\nRefresh devices\nDisplay by tags\nDevice ID: T1\nIP/MAC Address\nTags\nCurrent iApps\nL10MPC1001\n168.254.1.91\n02-42-49:63:87/ind\nADLINK SDAQ-278 Tower-Light\nOEE\nK785EC1010\n168.254.1.30\n02-42-70:07:79\nADLINK SDAQ-204 Motor\nVibration\nM9043NCA01\n168.254.1.06\n02-42-ad:09:0c:33\nADLINK SDAQ-278 Power-Source\nPower_Monitoring](.sdaq-216-218-50m-00120-1000-10/47ac2a828b9d64032228d5d09b83c45064deb671f02ebab953200ca77c090906.jpg)

3. Select a tag and a target iApp to deploy and click Deploy. The target iApp will be deployed to the target device.

![Tags\nADLINK\nADLINK\nSDAQ-216\nTower-Light\nSDAQ-204\nmotor](.sdaq-216-218-50m-00120-1000-10/d354a18f46a5496a8ae40ae08c9b738a73ff2e67e30d4333ea00fb90f256a705.jpg)

![Tags\nADLINK SDAQ-216 Tower-Light\nDeploy by tags\nTags\nADLINK\niApp\nPower_Monitoring\nOEE\nPower_Monitoring\nVibration](.sdaq-216-218-50m-00120-1000-10/3d31d0d293bc0fc382289934e3c9d13aa3292b78f64f9b513f52e3e7a95958fe.jpg)

This page intentionally left blank.

# 4 Web Console

This chapter describes how to use the built-in web console to configure the SDAQ-216/218 and view captured data.

# 4.1 Web Console Login

After the SDAQ-216/218 has been successfully powered on and a host PC has been connected to it, do one of the following: (1) set the PC's network setting to either DHCP mode or link local mode; or (2) modify the PC's IP address to be on the same network segment as the device (169.254.x.x). Next, open a web browser on the PC (Google Chrome is recommended) to access the web console via one of the following options.

# Option 1: IP Address

1. Get the IP from the DAQPilot ACE (see step 2 below). DAQPilot ACE available for download on the SDAQ-216/218 product web page:

SDAQ-216: https://www.adlinktech.com/Products/Data\_Acquisition/SmartDAQ/SDAQ-216

SDAQ-218: https://www.adlinktech.com/products/Data\_Acquisition/SmartDAQ/SDAQ-218

2. In the web browser's address bar, enter the IP address (e.g., http://169.254.1.30).

![ADLINK Connection Explorer Version: 22.10.1110\nDAQ Pilot ACE\nDevice Manager\niApp Creator\nACE Handbook\nManage Devices\nRefresh devices\nDevice ID ↑↓ IP/MAC Address\nK785EC1010 169.254.1.30\n02:42:9e:84:be:5c](.sdaq-216-218-50m-00120-1000-10/1cfa4c7ae80b60ad83792edc7791bb5135fb097793aca15e09edad525ddda101.jpg)

# Option 2: Hostname

Connect the SDAQ-216/218 to a network component (switch/router) with DNS functionality, then enter the SDAQ-216/218's hostname in the address bar of the host PC's web browser, prefaced by http:// (e.g., http://mcm216-j801ns1001). A unique default hostname is generated for each SDAQ-216/218 device and can be found on the label of the box it was shipped in. The hostname can be changed within the web console.

After using either method, the web console will display within roughly 30 seconds, presenting the user with a login screen.

The default username is administrator and the default password is Adlink6166.

![ADLINK\nMenu\nLogin\nPlease login first.\nUsername *\nPassword *\nLOGIN\nCopyright © 2019 ADLINK Technology Inc. All Rights Reserved.](.sdaq-216-218-50m-00120-1000-10/f59fbfb30f9ba9e79ef436319bb5d0a6d92fffd23dc51443be352a79cd4de965.jpg)

Figure 4-1: Web Console Login Page

Immediately after logging in to the Web Console, DAQPilot Setting must be disabled before continuing.

![System Manager\nSystem Settings\nNetwork Settings\nAccount Management\nChange Password\nData Keep\nData Keep: ○ Enable ● Disable\n('Enable' to store history data in DISK and RAM, 'Disable' to only store it in RAM)\nRESTART\nAPPLY\nDAQPilot Setting\nDAQPilot Setting: ○ Enable ● Disable\nAPPLY](.sdaq-216-218-50m-00120-1000-10/29018a1d492399eec942984a05c5c47338cb00f61ac0d68bcf04d12601197000.jpg)

Figure 4-2: Disabling DAQPilot Setting

# 4.2 Web Console Menu

The web console menu bar includes the following items.

▶ Mission Manager
▷ Device Setting
▶ Mission Management
▷ Peripheral

▶ Data Manager

▷ Data Capture
Data History
Data Condition
▷ TCP Socket
▷ USB Storage
Modbus TCP Server
Modbus RTU Mater

▶ Information

▷ System information

▶ System Manager

▷ System Setting
▷ Network Setting
▶ Account Management
▶ Change Password

![The image features a red, upward-pointing triangle shape with the white number '100' centered inside it against a white background.](.sdaq-216-218-50m-00120-1000-10/2e715f15c6f14946ed8df2fe42d0d1158f0ae957c9c18c4106e10edef9463d04.jpg)

# ADLINK

LOGOUT

![Menu\nMission Manager\nDevice Settings\nMission Management\nPeripherals\nData Manager\nData Capture\nData History\nData Conditions\nTCP Socket\nUSB Storage\nModbus TCP Server\nModbus RTU Master\nInformation\nSystem Information\nSystem Manager\nSystem Settings\nNetwork Settings\nAccount Management\nChange Password\nDevice: MCM-216-A Account: administrator Role: admin Restful API Documentation\nWelcome\nDevice Name : MCM-216-A\nHostname : MCM204\nEthernet IP Address : 169.254.1.1\nEthernet MAC Address : 10.08.2c.bf.01.a7\nTime : 2020-12-25 15:17.20(Asia/Taipei)\nTurn On : Dec 25 15:13.10\nSerial Number : ###########](.sdaq-216-218-50m-00120-1000-10/34a8945d31d28f0585e83bb6bd44a964c88ec332615ac173bb2fe779eced1455.jpg)

Figure 4-3: Web Console Welcome Page

Depending on the host PC screen size and resolution, the menu list might be collapsed. Click the menu icon to expand the menu.

![The image displays a red, stylized graphic resembling an uppercase letter 'A' or a triangle on a white background. The red shape has four horizontal white cuts running across its lower section, and its bottom edge curves upward, creating an arch-like shape.](.sdaq-216-218-50m-00120-1000-10/f25717ddcbe07482d9c97d0ff67495576a631631ed3a145e796b2a0a0ecfa347.jpg)

# ADLINK

![Simple black arrow pointing left on a red background (no text or symbols)](.sdaq-216-218-50m-00120-1000-10/fa58463b3ff083a91019658d840a3a38c4054865c801643deea188573471a8d2.jpg)

Device: MCM-204 Account: administrator Role: admin

Welcome

Figure 4-4: Menu Icon

# 4.2.1 Information/System Information

The System Information page shows the device software version, general information, I/O channel status, and network status.

System Information

Software Version

Firmware Version : 20.10.1225

Device Information

Model : MCM-216-A

Hostname : MCM204

Serial Number : ########

Time: 2020-12-25 15:17:55(Asia/Taipei)

Turn On : Dec 25 15:13:10

Channel Status

Channel Status : AI : ready Log Count:0

REFRESH

Network Status

Ethernet

IP Address : 169.254.1.1

MAC Address : 10:08:2c bf:01:a7

Subnet Mask : 16

Gateway : 0.0.0.0

Type : static

DNS:8.8.8.8

RFFRFSH

Figure 4-5: System Information

# 4.2.2 Mission Manager/Peripheral

Peripheral digital input/output and temperature sensor information is shown on this page. The Status area shows the current status of the peripherals. Select REFRESH to update the status.

Four digital input/output devices can be used. Each can be adjusted for either input or output mode. To enable/disable digital input/output, mark the appropriate check boxes as necessary.

![Peripheral\nAuto-Refresh per 5 seconds\nStatus\nA06 Closed (0.0) A01 Closed (0.0)\nD01 Input (High) D01 Input (High) D02 Input (High) D03 Input (High)\nD06 Output (Low) D01 Output (Low) D02 Output (Low) D03 Output (Low)\nTemperature N/A\nREFRESH\nDigital I/O Setting\nValue\nEnable D00 Output Low\nValue\nEnable D01 Output Low\nValue\nEnable D02 Output Low\nValue\nEnable D03 Output Low](.sdaq-216-218-50m-00120-1000-10/533bc23eb377e635c4c010c1c2b98bab5fd1ffae59b1e55f3a3ede045ddce447.jpg)

Figure 4-6: Peripheral Devices

# 4.2.3 Data Manager/Data History

Historical data can be retrieved in this page. Choosing a specific time period will speed up the data search.

![History Data\nClear\nCLEAN ALL DATA\n*This will delete all data history.\nSearch Filter :\nAll User\nUser:\nAll Time\nFrom:\nYear Month Day Hour Min Sec\n2020 11 28 15 18 55\nTo:\nYear Month Day Hour Min Sec\n2020 12 25 15 18 55\n*Use the '*' and '.' keys on the keyboard to modify the value.\nSEARCH](.sdaq-216-218-50m-00120-1000-10/b747e47b99defcfe77946ba64f34a3248b5369db801c1096b0433a5485b59f44.jpg)

Figure 4-7: Data History

# 4.2.4 Mission Manager/Mission Management

A mission is a setting of I/O parameters with an intended output method. The SDAQ-216/218 will execute the same settings even after a reboot, so if Repeat Times is set to 0 (endless data capture), the SDAQ-216/218 will run its previous mission after reboot. To configure the I/O parameters for another mission, delete the current mission.

Channel Status shows if the AI and DI/O are running a mission or are ready to be assigned a new mission.

![Mission Management\nDelete Mission\nClick the DELETE button to stop the current mission.\nDELETE\nChannel Status : Already AOready Log Count:0\nREFRESH](.sdaq-216-218-50m-00120-1000-10/a171a78db6351bfadc28c23339a7c6608112548a0909d05835b9e2379d5bc2d6.jpg)

Figure 4-8: Mission Management

# 4.2.5 System Manager/Change Password

This page is used to change the password of each SDAQ-216/218, whether there is a single device or multiple daisy chained devices. It is recommended that each device have a unique password since the default password for every SDAQ-216/218 is identical.

![Change Password\nStep 1:Enter current password\nOriginal Password\nCHECK](.sdaq-216-218-50m-00120-1000-10/2421a91c791dc2d095cd55676a0acab8961309c903e08492e38bd15745b34261.jpg)

Figure 4-9: Change Password

# 4.2.6 System Manager/Account Management

This page manages user accounts and access privileges.

![Account Management\nCreate New Account\nUsername Password Password Confirm Permission Guest\n*The password must be at least 8 characters, have at least one uppercase character, at least one lowercase character and at least one number.\nCREATE\nAccount List\nNo. Username Permission Action\n1 administrator admin](.sdaq-216-218-50m-00120-1000-10/6085b021155ca925b41bf81cd8aba2f8c18ce3267c736d8c5fe9805e639058d6.jpg)

Figure 4-10: Account Management

# 4.2.7 System Manager/Network Setting

This page manages various system settings.

Hostname: The device's hostname can be modified by entering a new hostname here and clicking the APPLY button. A hostname can be used instead of an IP address to access a specific device's web console. See "Web Console Login" on page 37 for details.

Keep Network Setting: Select Enable to retain network settings even after the device has been reset to factory defaults.

![Network Settings\nETHERNET\nWi-Fi\nNetwork Settings\nHostname\nMCM204\nEthernet\nType\nStatic\nAddress\n169.254 1.1\nGateway\n0 0 0.0\nMask\n16 - 255.255 0.0\nDNS 1\n8.8.8.8\nDNS 2\nAPPLY\nKeep Network Settings : ○ Enable ● Disable\n(*Enable' to keep the network settings after restoring factory settings, 'Disable' to restore all settings.)\nAPPLY](.sdaq-216-218-50m-00120-1000-10/2c84a3c8e18be2cd71b2942157b8cd4e198562ec239f105bcc69fda7624b7f33.jpg)

Figure 4-11: Network Settings

# 4.2.8 System Manager/System Setting

![System Settings\nTime Setting\nTime: Year Month Day Hour Min Sec.\n2020 12 25 15 22 07\n'Use the '*' and '-' keys on the keyboard to modify the value.\nTime Zone NTP Server\nAsia/Taipei 0 us.pool ntp.org\nAPPLY\nSystem Restart\nClick RESTART to reboot the device.\nRESTART\nData Keep\nData Keep: Enable Disable\n('Enable' to store history data in DISK and RAM, 'Disable' to only store it in RAM.)\nAPPLY\nDDS Setting\nDDS Setting: Enable Disable\nAPPLY](.sdaq-216-218-50m-00120-1000-10/df30796f0299038adc0baa09557696f481ecfe17bfa2645a34d09a9396e9e151.jpg)

Figure 4-12: System Settings

System Restart: Since the device may be deployed in at a remote site, if it is necessary to reboot the device, click RESTART to soft reboot the device.

Data Keep: By default, the SDAQ-216/218 stores history data only in RAM and the data is lost when the system reboots. Select Enable to also save history data to internal storage. The amount of disk space allocated for this purpose is 300MB. When that limit is reached, data that has gone for the longest period of time without being accessed will be overwritten first, thus preserving the data that has been accessed most recently.

Device Calibration: The SDAQ-216/218 can be recalibrated if necessary. Though the SDAQ-216/218 is factory-calibrated before shipment and associated calibration constants are written to the on-board EEPROM, it is possible that, over time or depending on temperature conditions, recalibration may become necessary.

Customization Library Upload: This function runs custom formulas on the SDAQ-216/218 according to a given file. See “Custom Filtering Algorithms” on page 56.

Firmware Upgrade: A firmware upgrade file can be uploaded to the SDAQ-216/218 through this feature. These files will periodically be provided through the product web page:

SDAQ-216: https://www.adlinktech.com/Products/Data\_Acquisition/SmartDAQ/SDAQ-216

SDAQ-218: https://www.adlinktech.com/products/Data\_Acquisition/SmartDAQ/SDAQ-218

![DDS Setting\nDDS Setting: ○ Enable ● Disable\nAPPLY\nDevice Calibration\nClick APPLY to calibrate the device.\nAPPLY\nCustomization library Upload\nLibrary Upload 選擇檔案 未選擇任何檔案\n(Select a so file.)\nUPLOAD\nFirmware Upgrade\nFirmware Upgrade: 選擇檔案 未選擇任何檔案\n(Select a .bin file with the correct content.)\nUPLOAD\nFile not selected or invalid.](.sdaq-216-218-50m-00120-1000-10/e509e3fe2cdaae113138df1e0720d0aac08dff0c3e1a5dca8c19ca684e30cb10.jpg)

Figure 4-13: Upload Customization/Firmware Files

# 4.2.9 Data Manger/TCP Socket (for one-shut query mode)

The SDAQ-216/218 supports TCP socket communication as a socket client. Enter the IP address and port number of the remote TCP socket server. Different analog input channels can be mapped to different ports. Select ADD RULE to add the TCP server to the Socket Connection List.

The Status column shows the communications status with the corresponding TCP socket server. If the socket is disconnected, select RE-CONNECT ALL to re-establish the connection.

![TCP Socket\nAdd socket connection\nAddress	Port	Channel\n192.168.1.1	6666	ALL\nADD RULE\nSocket Connection List\nRE-CONNECT ALL\nSocket No.	Status	Address	Port	Channel	Action\n1	○	192.168.1.1	6666	ALL	Delete](.sdaq-216-218-50m-00120-1000-10/b07d2432aab58fd4c7b4f1b2c94978c8ced9d4137e281dda6e1bdfc4d592d258.jpg)

Figure 4-14: TCP Socket

After setting the TCP socket connection and creating a DAQ mission, data generated by the SDAQ-216/218 will immediately begin transmitting to the TCP server side.

# 4.2.10 Device Manager/Modbus TCP Server

In addition to the REST API, the Modbus TCP protocol can be used to access data generated from the MCM-216/218. The MCM-216/218 acts as a Modbus TCP server, and a remote Modbus TCP client can actively query the MCM-216/218.

![Modbus TCP Server\nServer Setting\nModbus TCP Slave	Port	Slave ID\nEnable	502	1\n\nAI Setting and information\nFunction Code:4\nAddress:30001. The length is 2.\nDescription:Save the AI data in the register. Supported data types: OA, Voltage, Raw Data, G and Custom.\nSelectable Data Values depend on the device settings.\nStarting Address	Data Value	Action\n0	Reserve	INSERT	DELETE\nADD\nAPPLY](.sdaq-216-218-50m-00120-1000-10/b5a77f748ab4a9e88a56058aab283e796a238b922d472e12cce74596a8823cf9.jpg)

Figure 4-15: Modbus TCP Server

Enable the Modbus TCP function, set a Modbus port number and assign a Slave ID to the MCM-216/218.

Before creating the Modbus register list, be sure to add a data type in each channel. Otherwise, the data value in the Modbus setting will only have Reserve and temperature as default. See “DAQ Mission” on page 55.

Once the device setting page has been set and applied, all the created device types for each channel will be shown in a list under Data Value.

The following examples show channels AI0 with two data types, AI1 with one data type, and AI2 with one data type.

![Channel Config\nAI0 Config\nEnable the Channel\nCoupling Input Range\nDC ±10\nData Type\nVoltage\nADD CONDITION\nData Type\nRawData\nADD CONDITION\nADD DATATYPE\nAI1 Config\nEnable the Channel\nCoupling Input Range\nDC ±10\nData Type\nVoltage\nADD CONDITION\nADD DATATYPE\nAI2 Config\nEnable the Channel\nCoupling Input Range\nDC ±10\nData Type\nVoltage\nADD CONDITION\nADD DATATYPE](.sdaq-216-218-50m-00120-1000-10/6e46d2e02f6d10c7749ecfea1ffd65c29cc48736f0db574831d51fa1f7157890.jpg)

Figure 4-16: Data Types for Modbus TCP

In the Modbus TCP settings page, the data value column will show the created data types. Each data type in an analog input channel occupies 2 modbus registers read by modbus function code 4, starting from address 30001.

![Modbus TCP Server\nServer Setting\nModbus TCP Slave	Port	Slave ID\nEnable	502	1\nAI Setting and information\nFunction Code:4\nAddress:30001. The length is 2.\nDescription:Save the AI data in the register. Supported data types: OA, Voltage, Raw Data, G and Custom.\nSelectable Data Values depend on the device settings.\nStarting Address	Data Value	Action\n0	Reserve	INSERT	DELETE\nTemperature\nAI0-Voltage\nAI0-RawData\nAI1-Voltage\nAI2-Voltage\nADD\nAPPLY\nMore Modbus information:\nFunction Code:1 - DO Read](.sdaq-216-218-50m-00120-1000-10/0ac9cd8351f94ad6b6e95f20c834f2923aedb903f9da6097bdbff0248e241b2c.jpg)

Figure 4-17: Modbus TCP Created Data Types

Now, you can allocate the register sequence accordingly.

Modbus TCP Server

Server Setting

<table><tr><td>Modbus TCP Slave</td><td>Port</td><td>Slave ID</td></tr><tr><td>Enable</td><td>502</td><td>1</td></tr></table>

AI Setting and information

Function Code:4

Address:30001. The length is 2.

Description: Save the AI data in the register. Supported data types: OA, Voltage, Raw Data, G and Custom. Selectable Data Values depend on the device settings.

<table><tr><td>Starting Address</td><td>Data Value</td><td colspan="2">Action</td></tr><tr><td>0</td><td>A10-Voltage</td><td>INSERT</td><td>DELETE</td></tr><tr><td>2</td><td>A10-RawData</td><td>INSERT</td><td>DELETE</td></tr><tr><td>4</td><td>A11-Voltage</td><td>INSERT</td><td>DELETE</td></tr><tr><td>6</td><td>A12-Voltage</td><td>INSERT</td><td>DELETE</td></tr></table>

APPLY

Figure 4-18: Data Value Starting Address Allocation

Other peripherals, such as digital input, digital output, and analog output can be operated by different Modbus function codes and addresses.

![More Modbus information:\nFunction Code:1 - DO Read\nDescription:Read DO modbus register. Each starting address indicates a channel.\nStarting Address Channel\n0 D00\n1 D01\n2 D02\n3 D03\nFunction Code:2 - DI Read\nFunction Code:3 - AO Read\nFunction Code:15 - DO Write\nFunction Code:16 - AO Write](.sdaq-216-218-50m-00120-1000-10/f4d4928ec0ccf293b57aedcb0e9a016638c2b29e3d0e90d71b7ad1e5b45f3eec.jpg)

Figure 4-19: Modbus Function Codes

# 4.3 DAQ Mission

The SDAQ-216/218 performs signal detection. Related parameters can be set via the Mission Manger/Device Setting page.

Device Settings
![Analog Input\nAnalog Output\nAI Mission Profile Management\nSave Profile Load Default Select Mission Profile\nSAVE PROFILE LOAD DEFAULT 遵接檔案 未選擇任何檔案\nLOAD SETTING\nAI Data Mode\nOne Shot (default) Stream Mode with TCP Socket\n'You can set TCP Socket in 'Menu' - 'Data Manager' - 'TCP Socket' in one shot mode.\nAI Device Configuration\nInput Type Trigger Source Trigger Direction Trigger Value\nSingle-Ended (RSE) NoWait Rising 1\nTrigger Mode Trigger StartPos\nPOST 0\nRepeat Interval Repeat Times Sample Rate Data Count\n3000 1 250000 10240\nMax:250000 Min:1\nData Count Boundary\nChannel Gain Queue\nQueue Content:\nAI0 , AI1 , AI2\nDefault AI0 , AI1 , AI2,\nBACKSPACE\nClick and Add:\nAI0 AI1 AI2 AI3 AI4 AI5 AI6\nChannel Gain Queue\nQueue Content:\nAI0\nDefault AI0,\nBACKSPACE\nClick and Add:\nAI0 AI1 AI2 AI3 AI4 AI5 AI6\nAI7 AI8 AI9 AI10 AI11 AI12 AI13\nAI14 AI15\nOnly enabled channels can be added.](.sdaq-216-218-50m-00120-1000-10/629c7ec404a1a4c718c78d24256a2c8d5834776ec6af44b1aa8a565619e138ac.jpg)

Figure 4-20: Device Configuration

AI Data Mode: There are two kinds of data query modes.

One Shut Mode queries data by time interval. By configuring all the settings, including repeat interval, repeat times, and sample rate, the device will query data accordingly.

Streaming Mode, with a TCP socket, queries data continuously. Hence, the repeat interval and repeat time settings are unavailable. Once the data has been queried from FPGA, the data will then be transmitted to the host PC via TCP socket. Set the IP and port number of the TCP socket server accordingly.

Input Type selects the wiring method, either single-end or pseudo-differential.

# Trigger Modes

Analog input supports post, delay, middle, gate, post trigger with retrigger, and delay trigger with retrigger modes.

# Post-Trigger Acquisition Mode (no retrigger)

Post-trigger acquisition is indicated in applications where data is to be collected after a trigger event, as shown.

![Based on the provided image, here is a concise description of the flowchart and block diagram:\n\n**Timeline and Events:**\n*   A horizontal arrow pointing to the right is labeled **'Time'**.\n*   Three distinct points are marked on the timeline with downward-pointing arrows:\n    1.  **'Operation start'** (leftmost point).\n    2.  **'Trigger Event Occurs'** and **'Acquisition start'** (middle point).\n    3.  **'Acquisition stop'** and **'Begin to transfer data to system'** (rightmost point).\n\n**Signal Lines:**\n*   Below the timeline is a horizontal line labeled **'Trigger'**. It displays a square pulse (high signal) that aligns vertically with the **'Trigger Event Occurs'** point.\n*   Below the trigger line is a horizontal line labeled **'Data'**. It features a rectangular box containing the text **'N samples'**. This box spans the duration between the trigger pulse and the **'Acquisition stop'** point.](.sdaq-216-218-50m-00120-1000-10/ca4c4b30dfef014fd98eb5dc45a005772460d2407e8e5095989f81f847c19e83.jpg)

Figure 4-21: Post Trigger without Retrigger

# Pre-trigger Acquisition (no retrigger)

Collects data before the trigger event, with acquisition starting once specified function calls are executed to begin the pre-trigger operation, and stopping when the trigger event occurs. If the trigger event occurs after the specified amount of data has been acquired, the system stores only data preceding the trigger event by a specified amount, as shown. Note that N must be equal to or less than 8k samples for all analog input channels.

![This diagram illustrates a sequence of events aligned along a timeline.\n\n**Timeline Section:**\n*   A horizontal arrow pointing right is labeled **Time**.\n*   An arrow points to the beginning of the timeline with the text:\n    *   **•Operation start**\n    *   **•Acquisition start**\n*   An arrow points further along the timeline with the text:\n    *   **•Trigger Event Occurs**\n    *   **•Acquisition stop**\n    *   **•Begin to transfer data to system**\n\n**Trigger Section:**\n*   Labeled **Trigger**, this line shows a pulse (a square wave going high then low) that aligns vertically with the second timeline event ('Trigger Event Occurs').\n\n**Data Section:**\n*   Labeled **Data**, this section shows a long bar extending across the bottom.\n*   The bar is divided into two distinct sections:\n    *   A left section filled with diagonal hatching.\n    *   A right section (white box) labeled **N samples**.\n*   Underneath these sections are annotations with curly braces:\n    *   Under the hatched section: **This data is discarded.**\n    *   Under the 'N samples' section: **Only acquired N samples will be transferred back to system.**](.sdaq-216-218-50m-00120-1000-10/e11325ff8febe3a5c6174fcf4c03d8b5deca2725c9d1745ce49537d269bb3003.jpg)

Figure 4-22: Pre-trigger Mode Operation (valid trigger only)

The trigger event occurs after the specified amount of data has been acquired. However, if the trigger event occurs before the specified amount of data has been acquired, the acquisition engine ignores the trigger signal until the specified amount of data has been acquired, as shown.

![The image displays a timeline diagram illustrating a data acquisition process involving pre-trigger buffering.\n\n**Top Section (Timeline & Events):**\n*   A horizontal arrow labeled **'Time'** extends to the right.\n*   An arrow points down to the start of the timeline, associated with the text:\n    *   **'Operation start'**\n    *   **'Acquisition start'**\n*   A dotted arrow points down to the first pulse on the timeline, associated with the text:\n    *   **'Trigger signals that occur before the specified amount of data has been acquired are ignored'**\n*   An arrow points down to the second pulse on the timeline, associated with the text:\n    *   **'Trigger Event Occurs'**\n    *   **'Acquisition stop'**\n    *   **'Begin to transfer data to system'**\n\n**Middle Section:**\n*   Labeled **'Trigger'**, this row displays a signal waveform containing two square pulses. The first pulse aligns vertically with the dotted arrow above, and the second pulse aligns with the arrow above the event list.\n\n**Bottom Section:**\n*   Labeled **'Data'**, this row displays a horizontal bar representing the data buffer.\n*   The bar is divided into a hatched section on the left and a section on the right labeled **'N samples'**.\n*   Below the hatched section, dimension lines point to it with the text:\n    *   **'X samples have been acquired before trigger occurs, where X(N'**](.sdaq-216-218-50m-00120-1000-10/d8100dc7e745bcf98aa8f39a7c77560abd2ba269ac95ce9ee2b24ff1e0518ff7.jpg)

Figure 4-23: Pre-trigger Mode Operation (w/ invalid trigger)

# Delay-Trigger Acquisition (no retrigger)

Delays data collection after the trigger event, as shown. The delay count is specified by a 32-bit counter value, such that the maximum delay count is $(2^{32}-1)$ when the minimum delay count is 1.

![The image displays a timing diagram consisting of a timeline and corresponding signal waveforms.\n\n**Timeline and Events:**\n*   A horizontal arrow pointing to the right serves as the axis, labeled **'Time'**.\n*   Vertical arrows point down to the timeline indicating specific events:\n    *   **'•Operation start'**\n    *   **'•Trigger Event Occurs'**\n    *   **'•Acquisition start'**\n    *   **'•Acquisition stop'** and **'•Begin to transfer data to system'**\n\n**Connections:**\n*   A horizontal line labeled **'Delay Time'** connects the point on the timeline under **'•Trigger Event Occurs'** to the point under **'•Acquisition start'**.\n\n**Signal Waveforms:**\n*   Below the timeline, a signal labeled **'Trigger'** shows a single square pulse.\n*   Below that, a signal labeled **'Data'** features a long line containing a hexagonal block labeled **'N samples'**.](.sdaq-216-218-50m-00120-1000-10/d60032ae6ce0dde61683cfeaf2c67d8e59579709ead3de8c7c45a370e2115326.jpg)

Figure 4-24: Delay-Trigger Mode Operation

# Middle-Trigger Acquisition

Middle-trigger acquisition is indicated when data is to be collected before and after the trigger event. The amount of stored data before and after trigger event can be set individually (M and N samples), as shown. Please note that M+N must be equal to or less than 8k samples for all analog input channels, and that the trigger event can only be accepted when the specified amount of data has been acquired (M samples), otherwise the trigger event will be ignored.

![The diagram illustrates a timing sequence with three horizontal tracks:\n\n**1. Time Axis (Top)**\n*   A horizontal arrow pointing right is labeled **'Time'**.\n*   On the left, text reads:\n    *   **'Operation start'**\n    *   **'Acquisition start'**\n*   On the right, text reads:\n    *   **'Trigger Event Occurs'**\n    *   **'Acquisition stop'**\n    *   **'Begin to transfer data to system'**\n    *   A downward arrow points from this text block to the timeline.\n\n**2. Trigger Track (Middle)**\n*   Labeled **'Trigger'**.\n*   It shows a signal line that goes high (pulses) briefly, aligning with the 'Trigger Event Occurs' point on the time axis.\n\n**3. Data Track (Bottom)**\n*   Labeled **'Data'**.\n*   It shows a rectangular block divided into two segments:\n    *   A left segment shaded with diagonal stripes.\n    *   A right segment labeled **'N samples'**.\n\n**4. Annotations (Bottom)**\n*   Under the hatched segment, a bracket reads: **'This data is discarded.'**\n*   Under the 'N samples' segment, a bracket reads: **'Only acquired N samples will be transferred back to system.'**](.sdaq-216-218-50m-00120-1000-10/ad7c115f52e1f602120b4365af9a205f09a27aeacd2254d7451e4dbc56050ff1.jpg)

Figure 4-25: Middle-Trigger Acquisition

# Gated Trigger

Gated-trigger acquisition is indicated in applications where data is to be collected when trigger events are set to level high/low, and acquisition suspended when trigger events are set to the opposite level. The process repeats until the specified amount of data is acquired.

![The image is a timing diagram illustrating a sequence of events over time, divided into three horizontal tracks:\n\n**1. Timeline and Events (Top Track):**\n*   A horizontal arrow pointing right represents the axis labeled **'Time'**.\n*   Three downward-pointing arrows indicate specific events:\n    *   The first arrow aligns with the start of the timeline and originates from the text: **'• Operation start'** and **'• Acquisition start'**.\n    *   The second arrow aligns with the first pulse and originates from the text: **'• Trigger event occurs (high active)'**.\n    *   The third arrow aligns with the second pulse and originates from the text: **'• Trigger event occurs (high active)'**.\n\n**2. Trigger Signal (Middle Track):**\n*   Labeled **'Trigger'**, this track shows a square wave signal.\n*   The signal goes low, then rises high corresponding to the first 'Trigger event occurs' arrow.\n*   It drops low again, then rises high corresponding to the second 'Trigger event occurs' arrow.\n*   The track ends with an ellipsis: **'....'**.\n\n**3. Data Blocks (Bottom Track):**\n*   Labeled **'Data'**, this track shows a sequence of rectangular blocks aligned vertically with the trigger signal.\n*   The sequence consists of:\n    *   A block with diagonal hatching (aligned with the start of the first trigger pulse).\n    *   A white block labeled **'M samples'** (aligned with the high portion of the first trigger pulse).\n    *   A block with diagonal hatching (aligned with the start of the second trigger pulse).\n    *   A white block labeled **'N samples'** (aligned with the high portion of the second trigger pulse).\n    *   A final block with diagonal hatching following the 'N samples' block.](.sdaq-216-218-50m-00120-1000-10/10ebfe222214d834fb37ec5a40a0a9a059e7eea2504aebcdb77303cc412dbe30.jpg)

Figure 4-26: Gated Trigger

# Post-Trigger or Delay-Trigger Acquisition with Re-Trigger

Post-trigger or delay-trigger acquisition with re-trigger function is indicated in applications where data is to be collected after several trigger events. The number of scans after each trigger and the re-trigger number are valid from 1 to the buffer size allocated in kernel space. The process repeats until the specified amount of re-trigger signals is detected.

Repeat Interval is the interval between each data capture, in milliseconds. Each data query consists of data capture via FPGA plus data filtering via MCU. The time required for data filtering may vary according to the complexity of the filtering algorithm. If the time required for handling data exceeds the repeat interval, the next time query will be started immediately. It is recommended that this value be set.

Repeat Times is the total number of times the data is to be captured. For endlessly repeating data capture, set to 0.

![This image displays a vertical warning sign. At the top is a red triangle containing a white exclamation point. Below the triangle, the word 'WARNING:' is printed in black, capital letters. The text appears to be cut off on the right edge.](.sdaq-216-218-50m-00120-1000-10/42269c591cf026f7597ba48d02216c835dfb13cebc1fd8038a7cadb776e3b892.jpg)

Warning! If you are using a customized algorithm as your Data Type, it is strongly recommended to set Repeat Times to 1 for the first attempt, then to 10 for a limited data capture test. Once you have confirmed the algorithm is running as intended, you can set Repeat Times to 0 for repeated data capture.

Set Sample Rate and Data Count accordingly. Selecting the pen icon to display a convenient sliding tool with fine-tuned (+/-) adjustments.

![Channel Gain Queue\nQueue Content:\nAI0\nDefault:AI0, AI1, AI2,\nBACKSPACE\nClick and Add:\nAI0 ✓ AI1 ✓ AI2 ✓ AI3 ✓ AI4 ✓ AI5 ✓ AI6\nAI7 ✓ AI8 ✓ AI9 ✓ AI10 ✓ AI11 ✓ AI12 ✓ AI13\nAI14 ✓ AI15 ✓\nOnly enabled channels can be added.](.sdaq-216-218-50m-00120-1000-10/f91dc35f4155c5b46410e2ecdcb9ee88e91561b55bde4062c529aeaa952cb761.jpg)

The MCM-216/218 provides the Channel Gain Queue function to dynamically allocate sampling size. By default, the selected channels will equally share the maximized sample rate. However, sampling rates can be allocated as necessary between channels. For example, when choosing 16 channels with a 250 kS/s sample rate, each channel will use 15.625 (250/16) as its sample rate. If a channel needs a higher sample rate, set the value accordingly.

To set the sample rate. first check the desired channels, then select the checkbox for each channel to include them in Queue Content. The sequence in Queue Content represents the allocated unit that each channel requires. Click as many times on the channel as needed. The sample rate will be shared according to the Queue Content.

As the figure below shows, channels 0, 1, 2, and 3 are selected. The sequence is AI0, AI0, AI1, AI3, AI2, AI2, AI2, AI2, and AI2. Hence, channel 0 will occupy 2/10 of the maximum sample rate. Channel 1 and 3 will occupy 1/10 of the maximum sample rate. Channel 2 will occupy 6/10 of the maximum sample rate. You can manually set the sample rate according to the device each channel connects to.

![**Header:** Channel Gain Queue\n\n**Queue Content Section:**\n*   **Label:** Queue Content:\n*   **Content:** A10, A10, A11, A13, A12, A12, A12, A12\n*   **Right Side Text:** Default: A10, A11, A12, A13,\n*   **Button:** BACKSPACE\n\n**Click and Add Section:**\n*   **Label:** Click and Add:\n*   **Grid Blocks (Top Row):**\n    *   A10 (Checked)\n    *   A11 (Checked)\n    *   A12 (Checked)\n    *   A13 (Checked)\n    *   A14\n    *   A15\n    *   A16\n*   **Grid Blocks (Middle Row):**\n    *   A17\n    *   A18\n    *   A19\n    *   A10\n    *   A11\n    *   A12\n    *   A13\n*   **Grid Blocks (Bottom Row - Left Side):**\n    *   A14\n    *   A15\n\n**Footer:** Only enabled channels can be added.](.sdaq-216-218-50m-00120-1000-10/fdac3e261a77425f718d50ac4a6f9cb4c6287bef2817605389d5c141be5bacdc.jpg)

For each analog input channel, click DataType to choose which data type to use for the output.

![Channel Config\nAI0 Config\nEnable the Channel\nCoupling\nInput Range\nDC\nRawData\nVoltage\nFFT_PowerSpec\nCustomization\n±10\nADD DATATYPE](.sdaq-216-218-50m-00120-1000-10/d40849484250022a23900bc78ac9ce22e6525bbe2a3f41401946a862c8013118.jpg)

Figure 4-27: DataType

An input range can be selected, as below.

![Channel Config\nAdd Config\nEnable the Channel\nCoupling\nDC\n±10\nData Type\nVoltage\n±2.5\n±1.25\n±0.3125\nADD CONDITION\nADD DATATYPE](.sdaq-216-218-50m-00120-1000-10/e83117a091dd43b952c8c1fe4915f083b9e5b1703a9e45f791dced3425bceb4d.jpg)

Depending on the channels selected, the Channel Config properties of each channel will be shown.

![This diagram is titled 'Click and Add' and displays a grid of selectable blocks representing channels. There are no visible connecting lines or arrows between the blocks; they are arranged in a grid layout.\n\n**Labeled Blocks:**\nThe blocks are arranged in rows and columns with the following labels:\n*   **Row 1:** AI0, AI1, AI2, AI3, AI4, AI5, AI6\n*   **Row 2:** AI7, AI8, AI9, AI10, AI11, AI12, AI13\n*   **Row 3:** AI14, AI15\n\n**Visual States:**\n*   **Pink blocks with a blue checkmark:** AI0, AI1, AI2, AI8, AI11, AI15\n*   **White blocks with a blue checkmark:** AI3, AI10\n*   **White blocks with an empty checkbox:** AI4, AI5, AI6, AI7, AI9, AI12, AI13, AI14\n\n**Footer Text:**\n'Only enabled channels can be added.'](.sdaq-216-218-50m-00120-1000-10/a088351fd62dd7289f54ad5b40007caa85f1b56cdae966bac32a41339fb701de.jpg)

![Channel Config\nAI0 Config\nAI1 Config\nAI2 Config\nAI8 Config\nAI11 Config\nAI15 Config](.sdaq-216-218-50m-00120-1000-10/9b84230c536f324cae253bb4a3a1cd9727aa72725aceb5bf30c4b1d3ef0df198.jpg)

The SDAQ-216/218 has built-in functionality for several common data types and also supports user-customized data types, as detailed in the table below. If two or more data types are required for an analog input channel, select ADD DATATYPE for each additional data type.

<table><tr><td>Data Type</td><td>Description</td></tr><tr><td>Raw Data</td><td>The raw data generated by ADC (16-bit, 2&#x27;s complement)</td></tr><tr><td>Voltage</td><td>Transferred from raw data</td></tr><tr><td>FFT_PowerSpec</td><td>Power spectrum transferred by fast Fourier transform (FFT)</td></tr><tr><td>Customization</td><td>Customized data type set by user</td></tr></table>

ADD CONDITION provides an event warning mechanism. When a given condition is triggered, a warning message will display on the Data Condition page.

![Channel Config\nAI0 Config\nEnable the Channel\nCoupling Input Range\nDC ±10\nData Type\nVoltage\nADD CONDITION\nName Severity Direction Value\nRule Warning Above 1\nADD DATATYPE](.sdaq-216-218-50m-00120-1000-10/c055ceaaeb6b0838c5c64410d59fd5e408460d7fd50e2c5c80feedc005780fcf.jpg)

Figure 4-28: Add Condition

After the desired settings have been configured, click APPLY to activate your changes.

# Analog Output

![Device Settings\nAnalog Input	Analog Output\nAO Channel Config\nAO0 Config\nConfig the Channel\nAO Output Type\nClosed\nAO1 C\nVoltage\nCurrent\nClosed\nAPPLY](.sdaq-216-218-50m-00120-1000-10/9184763a25ebffb9aca4d77003f4ffb68098b5c4cc87fd95539ffa2b65b43139.jpg)

The MCM-216/218 has two analog output channels: output voltage, or current with a predefined value.

![AO1 Config\n✓ Config the Channel\nAO Output Type	Current Value\nCurrent	20\nRange 0 - 20.](.sdaq-216-218-50m-00120-1000-10/dace135e7ba820dfc41d910d0ef78ee88d380b0bed742cd7a84ee3a9920ff485.jpg)

The Data Manager/Data Capture page displays DAQ results in real time. You can use the data capture function in lab testing or as a portable DAQ device. Raw data and Voltage can be converted to charts for troubleshooting.

![Capture Data\nData In JSON\n{ 2 items\n  'Data' : ( 2 items\n    0 : { 1 item\n      'AI0' : { 1 item\n        'OA_g(RMS)' : (...) 1 item\n        }\n    }\n    1 : { 1 item\n    'AI1' : { 1 item\n      'Voltage' : 10240 items\n        (0 - 1000 )\n        (1000 - 2000 )\n        (2000 - 3000 )\n        (3000 - 4000 )\n        (4000 - 5000 )\n        (5000 - 6000 )\n        (6000 - 7000 )\n        (7000 - 8000 )\n        (8000 - 9000 )\n        (9000 - 10000 )\n        (10000 - 10240 )\n    }\n    }\n    )\n    'Date' : '2019-10-25 11:06:07.972'\n}](.sdaq-216-218-50m-00120-1000-10/e9222d5bf64c3f6d51a9e11d01fdcd554b0a4ede8cdeecc281a15334683cfd5b.jpg)

Figure 4-29: Data Capture

![AI Mission Profile Management\nSave Profile	Load Default	Select Mission Profile\nSAVE PROFILE	LOAD DEFAULT	選擇檔案	未選擇任何檔案\n		LOAD SETTING\nAI Data Mode\nOne Shot (default) ○ Stream Mode with TCP Socket\n'You can set TCP Socket in 'Menu' - 'Data Manager' - 'TCP Socket' in one shot mode.](.sdaq-216-218-50m-00120-1000-10/6fa7f3a6fe6b6b43f682eab454e8144f58f1b63baa5315eaa3f09e1c076fca17.jpg)

Figure 4-30: Device Settings

Settings may be saved as a Mission Profile (JSON file) for backup or for convenient duplication on other SDAQ-216/218 devices. Click SAVE PROFILE to download the file to your PC. To import a Mission Profile to an SDAQ-216/218 device, click Choose File under Select Mission Profile and select the desired configuration file. All settings will change according to that file. Alternatively, clicking LOAD DEFAULT will restore all settings to their default values. After any change to device settings, the APPLY button must be clicked in order to activate the changes.

If a mission is already running while attempting to apply new changes, a confirmation window will appear. If you're ready for the SDAQ-216/218 to cancel its previous mission and start running the new mission, click YES.

![Device Settings\nAI/DI Mission Profile Management\nApply New Mission ?\nA previous mission is still running. Do you want to cancel the existing mission\nand apply new mission?\nYES	NO\nPseudoDifferential	NoWait	Rising	1\nDevice Config\nInputType	Trig Source	Trig Direction	Trig Value\nPseudoDifferential	NoWait	Rising	1](.sdaq-216-218-50m-00120-1000-10/d6a5723e77b829dd6bf8c152cc8f39facc3a5f6c65c6512e337bcadb65512cb1.jpg)

Figure 4-31: Apply a New Mission

This page intentionally left blank.

# 5 DAQ Missions

The SDAQ-216/218 supports various modes of operation that users can choose from to quickly integrate into their systems.

# 5.1 Usage Behaviors

IEPE sensors transmit raw data to the SDAQ-216/218 which can then be filtered to other kinds of data types that are more application appropriate, such as overall vibration values (ISO 10816) for mechanical vibration data. The overall vibration value data size is greatly reduced in comparison to raw data, so the backend server receives much less data for analysis. Data filtering is best suited to applications requiring continual information updates at a given time interval, such as every minute, which the user can then review periodically.

In contrast to data filtering, some applications, such as lab testing, require continuous raw data for analysis. However, continuous transmission of large amounts of raw data places a heavy burden on the backend server and takes up more network bandwidth. Evaluate your bandwidth and application requirements carefully in order to adopt the most suitable programming method for your needs.

There are three major usage behaviors: Periodic Polling, Continuous Data, and Passive Data. Choosing between them depends on how frequently data must be retrieved. Figure 5-1 on page 68 can serve as a guide for selecting the appropriate usage behavior for system integration based on polling data frequency.

For the periodic polling mode, SDAQ-216/218 provides a REST API and sample code in C#, Python, and JavaScript. Alternatively, for continuous data mode, SDAQ-216/218 provides a DAQPilot SDK and associated C/C++ sample code.

# 5.1.1 Web Console

The SDAQ-216/218 has a built-in, easy-to-use web console that implements all device functionalities. By logging into the web console through a connected host PC, users can see all of the device's current settings, each feature it provides, and any vibration data it has collected. See "Web Console" on page 37.

![This diagram illustrates a data processing architecture divided into three main sections: a top input layer, a middle processing layer, and a bottom data storage layer.\n\n**Top Section (Input Sources)**\nFour pink blocks labeled 'Configuration / See data in web', 'Periodically Polling Data', 'Passively get data', and 'Continuous Data' sit above corresponding yellow blocks labeled 'Web browser', 'REST API', 'TCP socket- server mode', and 'Streaming SDK'.\n\n**Middle Section (Processing/Interface)**\nThree grey blocks are labeled 'Web Console', 'REST Server', and 'TCP Socket- client mode'.\n\n**Bottom Section (Data Layers)**\nThree stacked grey blocks at the bottom are labeled 'Data in JSON format' (top), 'Filtered Data' (middle), and 'Raw Data' (bottom).\n\n**Connections**\n*   **Top to Middle:** Arrows point downward from the 'Web browser' area to 'Web Console' and from the 'REST API' area to 'REST Server'.\n*   **Middle to Top:** An arrow points upward from 'TCP Socket- client mode' to 'TCP socket- server mode'.\n*   **Top to Bottom:** An arrow points downward from 'Streaming SDK' all the way to 'Raw Data'.\n*   **Middle Internal:** An arrow points right from 'Web Console' to 'REST Server'.\n*   **Bottom Internal (Upward Flow):** Arrows point upward from 'Raw Data' to 'Filtered Data', and from 'Filtered Data' to 'Data in JSON format'.\n*   **Bottom to Middle (Upward Flow):** From 'Data in JSON format', arrows point upward to both 'REST Server' and 'TCP Socket- client mode'.](.sdaq-216-218-50m-00120-1000-10/e7d6f6eceaaed033d74514aba0fbe530449c0eeaf2fcf3026bf451077023d0fd.jpg)

Figure 5-1: Operational Modes

# 5.1.2 Periodic Polling

A RESTful API is provided to facilitate periodic data polling. The REST document can be found on the web console's menu bar.

![ADLINK\nMenu\nDevice: MCM-204 Account: administrator Role: admin\nSystem Information\nRestful API Doc](.sdaq-216-218-50m-00120-1000-10/c6179e675bd2b1b84593d98c3672bf2148aff0f89c3cf058b11b4c8ebf6e4548.jpg)

Figure 5-2: RESTful API

Using this API, functionalities shown in the web console can be implemented in your own custom software. Function references and sample code in Python, JavaScript, and C# are available for download on the SDAQ-216/218 product web page:

SDAQ-216: https://www.adlinktech.com/Products/Data\_Acquisition/SmartDAQ/SDAQ-216

SDAQ-218: https://www.adlinktech.com/products/Data\_Acquisition/SmartDAQ/SDAQ-218

# 5.1.3 Continuous Data

To use continuous data mode, first install the DAQPilot SDK, available for download on the SDAQ-216/218 product web page:

SDAQ-216: https://www.adlinktech.com/Products/Data\_Acquisition/SmartDAQ/SDAQ-216

SDAQ-218: https://www.adlinktech.com/products/Data\_Acquisition/SmartDAQ/SDAQ-218

After installation, sample code and function references can be found in the C:\Program Files\ADLINK\DAQPilot folder.

Before using the DAQPilot SDK, DAQPilot Setting must be enabled via the SDAQ-216/218 web console.

![System Restart\nClick RESTART to reboot the device.\nRESTART\nData Keep\nData Keep: ○ Enable ● Disable\n('Enable' to store history data in DISK and RAM, 'Disable' to only store it in RAM.)\nAPPLY\nDAQPilot Setting\nDAQPilot Setting ● Enable ○ Disable\nAPPLY](.sdaq-216-218-50m-00120-1000-10/d3be271b43af08f8f902b4a26d311458443bb1a5d0250791fbb0f31ad6966571.jpg)

Figure 5-3: DAQPilot Setting

![The image shows a triangular warning sign with a maroon background and a black border. Inside the triangle is a large black exclamation point. Below the triangle, the text 'WARNING:' is printed in black capital letters.](.sdaq-216-218-50m-00120-1000-10/4db2b1ac6284e4cdb23eaa5eeff5b5b47e08f0977e359e0e90a24f09858a972a.jpg)

▶ When using DAQPilot, the host server and SDAQ-216/218 must be deployed to the same network segment.
It is strongly recommended not to use the REST API for querying continuous data.

# 5.1.4 Passive Data

The conventional message exchange pattern of the SDAQ-216/218 for Periodic Polling and Continuous Data modes is request-response, with the SDAQ-216/218 serving as responder. After receiving a query from the host, the SDAQ-216/218 responds with the requested data. However, for some applications it's desirable for the host server to passively wait for data from the client. In such cases, a TCP socket function can instruct the SDAQ-216/218 to automatically send data to the host server whenever data is generated. See “Data Manger/TCP Socket (for one-shut query mode)” on page 49.

# 5.2 Custom Filtering Algorithms

The SDAQ-216/218 offers flexible support options for custom filtering algorithms. Users can easily import their own domain-knowledge algorithms to the SDAQ-216/218. Custom filtering algorithms must be written in C or C++ and compiled under Linux.

Use the following steps to create a custom filtering algorithm.

1. Download and extract the Linux toolchain:
https://releases.linaro.org/components/toolchain/
binaries/6.2-2016.11/arm-linux-gnueabihf/
gcc-linaro-6.2.1-2016.11-x86 64 arm-linux-gnueabihf.tar.xz

2. Download CustomizedAlgo.zip from the SDAQ-216/218 web page and extract the CalStatistic (C++) and CalRMS (C) sample program folders.

https://www.adlinktech.com/Products/Data\_Acquisition/

SmartDAQ/SDAQ-216/218

3. Place the extracted CalRMS and Linux toolchain folders in the same file path.

![gcc-linaro-6.2.1-\n2016.11-x86_64_\narm-linux-\ngnueabihf](.sdaq-216-218-50m-00120-1000-10/a82d9b292c60beb38f0f02cff2cc056b945fbaa67f47c895ed74f3181f199e71.jpg)

![The image features an orange folder icon positioned above the gray text 'CalRMS'.](.sdaq-216-218-50m-00120-1000-10/ca2de03e7d3eac68219be129ae80a298581806aeb9c1ea555bcc8bf6d7e3fe8e.jpg)

4. Run the "make" command from within the CalRMS folder to generate a customAlgo.so file.

![The image displays a white sheet of paper resting on a dark, possibly black, surface. The top right corner of the paper is curled upwards. The document appears to be a printed memorandum or letter, featuring a header section at the top right (likely containing fields for 'To,' 'From,' 'Date,' and 'Subject'), followed by several paragraphs of justified body text, and a closing section at the bottom. The text is blurry and illegible, making the specific content unreadable.](.sdaq-216-218-50m-00120-1000-10/e90bfccc92f1e65c72380c8341f17cb6408e8e4405191afb22b2b809e98a2791.jpg)

customAlgo.so

5. Upload customAlgo.so to the SDAQ-216/218 from the web console System Setting page.

![Customization library Upload\nLibrary Upload: Choose File No file chosen\n(Please Select a. so file.)\nUPLOAD](.sdaq-216-218-50m-00120-1000-10/409e675bc237068ed1d1bd8eb8ed78d5828a4b0486e6cf465b60472d475f0f89.jpg)

6. After it uploads, log back into the web console.

![You have to re-login .\nRe-login](.sdaq-216-218-50m-00120-1000-10/f5062666cc68adf8509310a85e21bd9b43e3d689b3d0b9ac75d52662afb47b58.jpg)

7. After logging in, choose Customization as the data type, set parameters as needed, then click APPLY to apply the task to the SDAQ-216/218.

![AI0 Config\nEnable the Channel\nCoupling Input Range\nAC ±10\nData Type Customization Parameter\nCustomization 'rms'\nADD DATATYPE\nSensor Type Sensor Sensitivity (mV/g) IEPE\nAccelerometer 100 Enable\nAI1 Config\nAI2 Config\nAI3 Config](.sdaq-216-218-50m-00120-1000-10/465041416e438f10bad7dee11fbbd1c9d1821f40b642aea24ab64d78b9e44b57.jpg)

APPLY

8. Check the results on the data capture page.

![1 item\n'Data': ( 2 items\n0 : { 1 item\n'AI0': { 1 item\n'Customization': ( 1 item\n0 : 1.0328374\n)\n}\n}\n1 : { 1 item\n'Date': '2019-10-23 16:47:21.967'\n}](.sdaq-216-218-50m-00120-1000-10/6c4559a4c76d7e9ebe1d24a2308d0d93c4ce569467952ae041fbb9d7fde35e2b.jpg)

# Important Safety Instructions

For user safety, please read and follow all instructions, Warnings, Cautions, and Notes marked in this manual and on the associated device before handling/operating the device, to avoid injury or damage.

S'il vous plaît prêter attention stricte à tous les avertissements et mises en garde figurant sur l'appareil, pour éviter des blessures ou des dommages.

▶ Read these safety instructions carefully.
- Keep the User’s Manual for future reference.
▶ Read the Specifications section of this manual for detailed information on the recommended operating environment.
The device can be operated at an ambient temperature of $50^{\circ}$ C.

▶ When installing/mounting or uninstalling/removing device, or when removal of a chassis cover is required for user servicing:

▷ Turn off power and unplug any power cords/cables.
▷ Reinstall all chassis covers before restoring power.

▶ To avoid electrical shock and/or damage to device:

▷ Keep device away from water or liquid sources.
▷ Keep device away from high heat or humidity.
▷ Keep device properly ventilated (do not block or cover ventilation openings).
▶ Always use recommended voltage and power source settings.
▶ Always install and operate device near an easily accessible electrical outlet.
▷ Secure the power cord (do not place any object on/over the power cord).
▶ Only install/attach and operate device on stable surfaces and/or recommended mountings.

▶ If the device will not be used for long periods of time, turn off and unplug it from its power source
▶ Never attempt to repair the device, which should only be serviced by qualified technical personnel using suitable tools

▶ A Lithium-type battery may be provided for uninterrupted backup or emergency power.

![This image features a yellow warning sign. The top portion is a triangle with a thick black border containing a large black exclamation point in the center. Below the triangle, the text 'CAUTION !' is printed in black, uppercase letters on the yellow background. Vertical black bars run along the left and right edges of the sign.](.sdaq-216-218-50m-00120-1000-10/38520fa402ec9b6f818079d7954ce22342232d7973b479340013b175ad613427.jpg)

Risk of explosion if battery is replaced with one of an incorrect type; please dispose of used batteries appropriately.

Risque d'explosion si la pile est remplacée par une autre de type incorrect. Veuillez jeter les piles usagées de façon appropriée.

▶ The device must be serviced by authorized technicians when:

The power cord or plug is damaged.
▷ Liquid has entered the device interior.
The device has been exposed to high humidity and/or moisture.
The device is not functioning or does not function according to the User's Manual.
The device has been dropped and/or damaged and/or shows obvious signs of breakage.

▶ Disconnect the power supply cord before loosening the thumbscrews and always fasten the thumbscrews with a screwdriver before starting the system up.

It is recommended that the device be installed only in a server room or computer room where access is:

▶ Restricted to qualified service personnel or users familiar with restrictions applied to the location, reasons therefor, and any precautions required.

▶ Only afforded by the use of a tool or lock and key, or other means of security, and controlled by the authority responsible for the location.

![Yellow triangular warning sign with black smoke symbol indicating hot weather](.sdaq-216-218-50m-00120-1000-10/b3ed8f468061142d901ac922fdf7c8ad4a7ce8974dc1c988339ff3f8fccbac02.jpg)

# BURN HAZARD

Touching this surface could result in bodily injury. To reduce risk, allow the surface to cool before touching.

# RISQUE DE BRÛLURES

Ne touchez pas cette surface, cela pourrait entraîner des blessures.

Pour éviter tout danger, laissez la surface refroidir avant de la toucher.

# Getting Service

Ask an Expert: https://www.adlinktech.com/en/Askanexpert

# ADLINK Technology, Inc.

No. 66, Huaya 1st Road, Guishan District

Taoyuan City 333, Taiwan

Tel: +886-3-216-5088

Fax: +886-3-328-5723

Email: service@adlinktech.com

# Ampro ADLINK Technology, Inc.

6450 Via Del Oro, San Jose,

CA 95119-1208, USA

Tel: +1-408-360-0200

Toll Free: +1-800-966-5200 (USA only)

Fax: +1-408-600-1189

Email: info@adlinktech.com

# ADLINK Technology (China) Co., Ltd.

300 Fang Chun Rd., Zhangjiang Hi-Tech Park

Pudong New Area, Shanghai, 201203 China

Tel: +86-21-5132-8988

Fax: +86-21-5132-3588

Email: market@adlinktech.com

# ADLINK Technology GmbH

Hans-Thoma-Straße 11

D-68163 Mannheim, Germany

Tel: +49-621-43214-0

Fax: +49-621 43214-30

Email: emea@adlinktech.com

Please visit the Contact page at www.adlinktech.com for information on how to contact the ADLINK regional office nearest you.